Acute Pericarditis
There are four stages of pericarditis. The classic ECG findings in patients with pericarditis (ST elevation and PR depression) appear in the preacute and acute stages. ECG changes in other stages differ.
- Stage 1 – Preacute and acute pericarditis
- ST elevation and PR depression (in 50% of patients)
- Positive T waves
- Stage 2 – Intermediate pericarditis
- Isoelectric ST and PR waves
- Flattened T waves
- Stage 3 – Subacute pericarditis
- Isoelectric ST and PR waves
- Inverted, diffuse T waves
- Stage 4 – Post pericarditis
- ECG reverts to normal
Table 0-1. Etiology of Acute Pericarditis

Preacute Stage
During the preacute phase, slight PR depression is observed between the end of the p wave and the beginning of the QRS complex. Since this ECG characteristic is extremely rare in other cardiac conditions, it can be considered an isolated ECG sign of early-onset pericarditis.
Acute Stage
As the patient enters the acute stage, ST elevations 2 mm or less appear in any of the 12 leads except aVR. ST depression may be a finding in aVR (and at times V1).
- ST elevation is more pronounced in leads V3 through V5 (mid) or V5 and V6 (lateral).
- ST segment elevation in acute pericarditis arises from the S wave in the mid-precordial leads V3 through V5.
- In the limb leads and lateral leads (V5/V6), ST segment elevation arises from the R downstroke.
- PR depression is evident in 50% of patients with acute pancreatitis.
Since the ECG changes in acute pericarditis resemble those in acute MI, the clinician must know how to distinguish their ECG tracings. Patients with both conditions present with chest pain and elevations in cardiac biomarkers.

72-Year-Old Man With Pericardial Effusion ECG
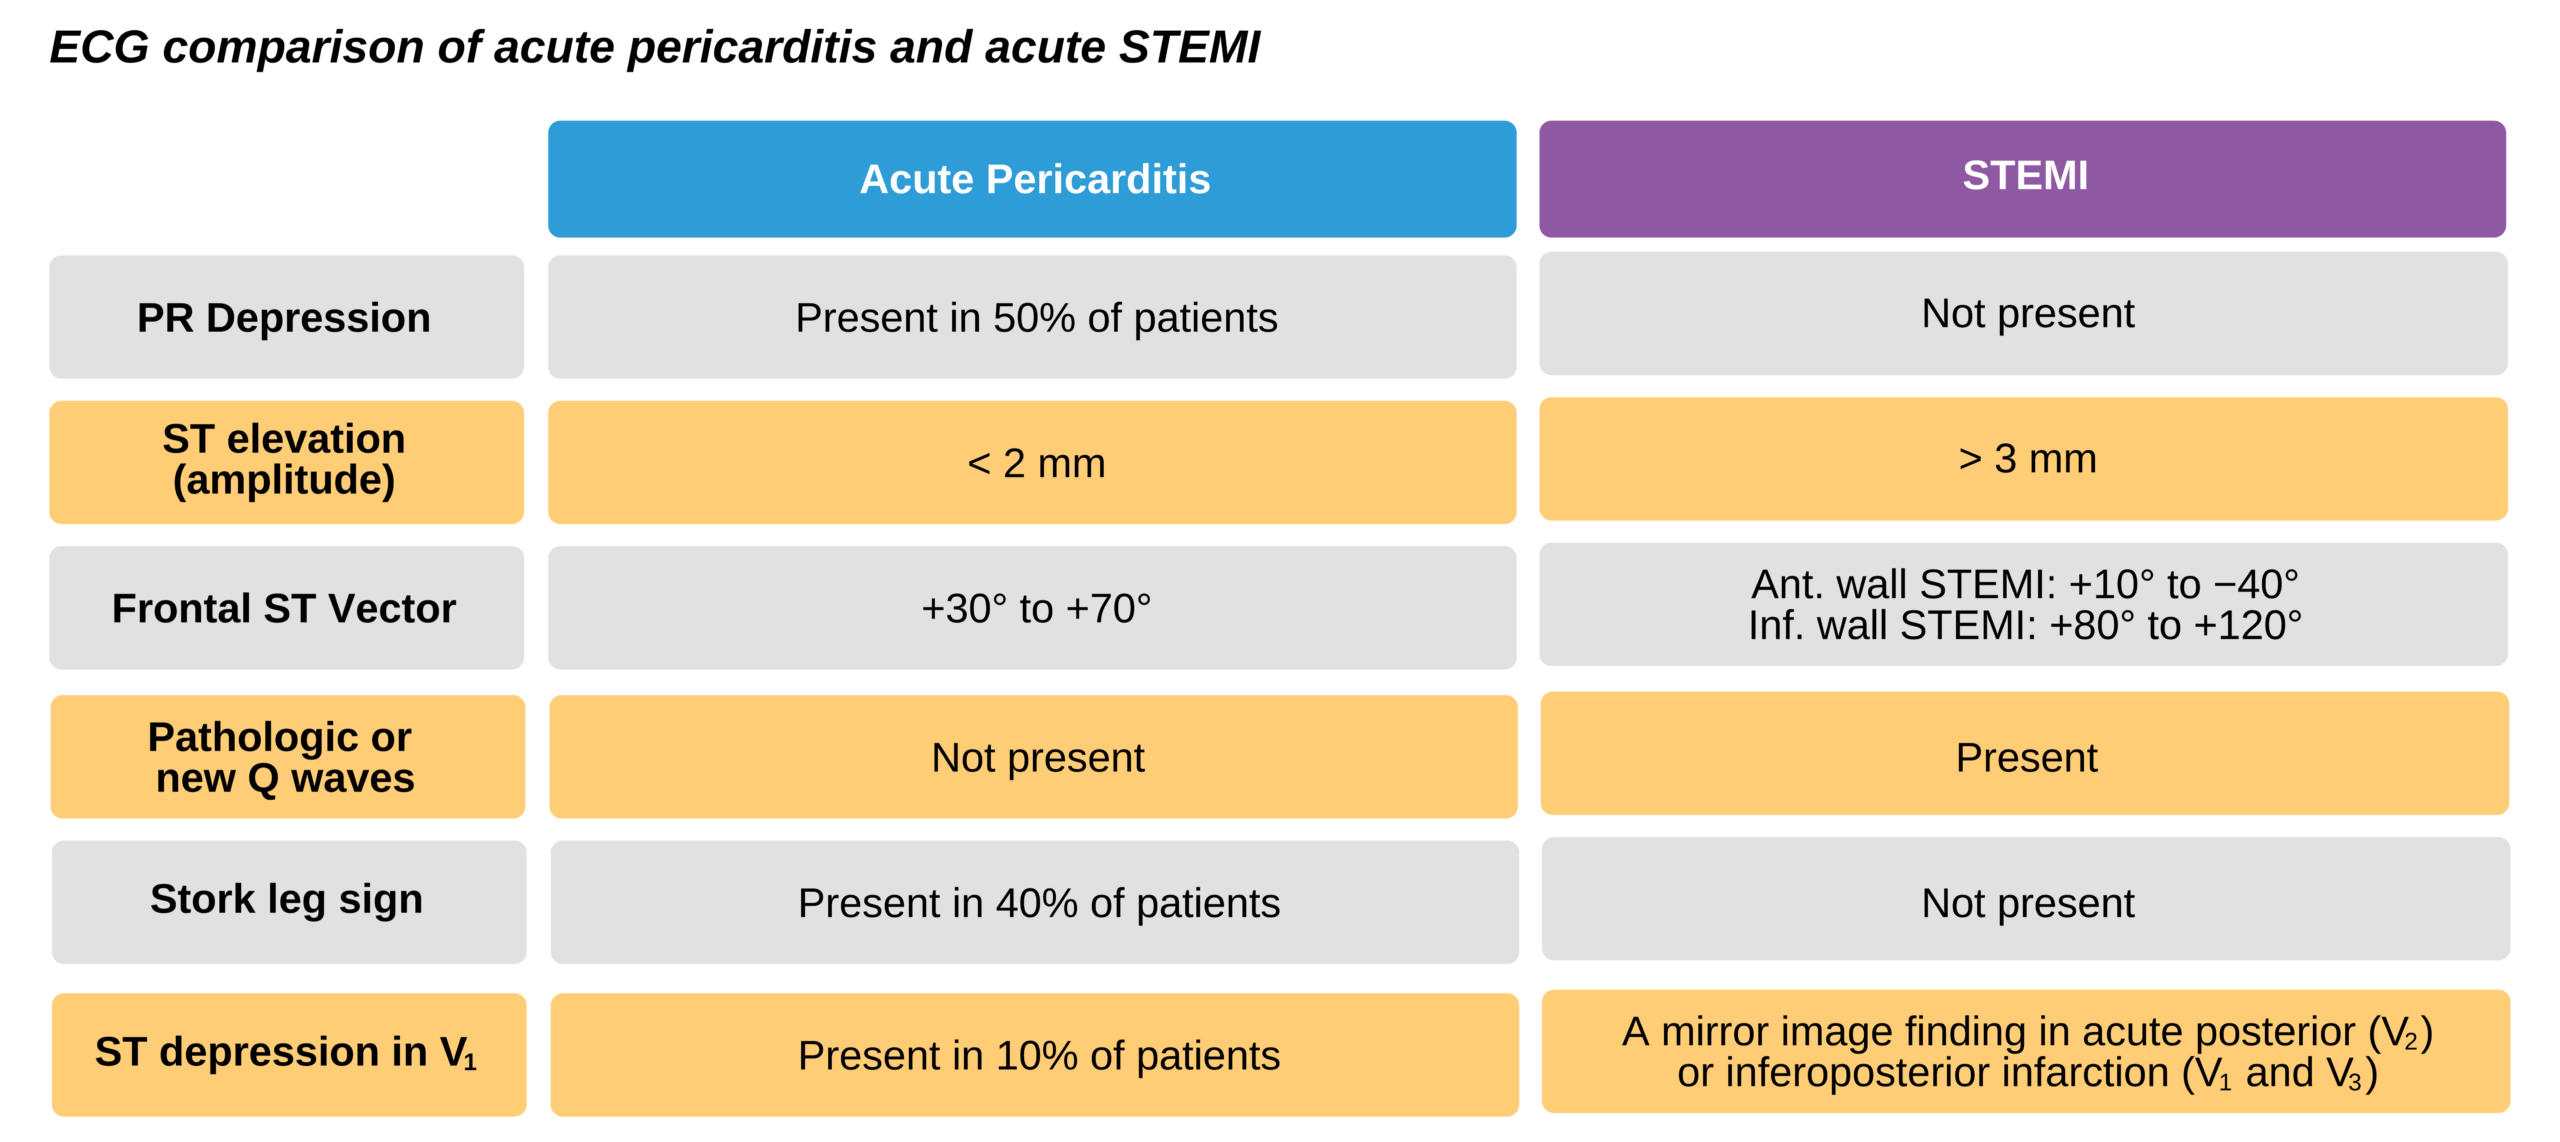
Differentiating Pericarditis from Acute Myocardial Infarction
The ST elevation morphology can be used to distinguish acute pericarditis from acute ST elevation myocardial infarction (STEMI).
ST segment elevation in acute pericarditis begins at the J point, which is the junction between the end of the QRS complex and the beginning of the ST segment. The J point rarely exceeds 5 mm, and the ST segment retains its normal concavity. In contrast, typical ST elevation in STEMI is convex (dome-shaped) and exceeds 5 mm.
The ST segment elevations in STEMI are distributed to the leads that correspond to the localized vascular area of the infarct. For example, a patient with an anteroseptal and anterior wall MI has STEMI changes in leads V1 through V4, while STEMI changes in a patient with a lateral wall MI appear in leads I, aVL, V5, and V6. Since the pericardium envelops the whole heart, ST segment changes should manifest in most of the ECG leads in the patient with acute pericarditis.
Acute MI presents with reciprocal changes in ST elevations as the infarcted area improves or worsens. These changes are not seen in acute pericarditis, except sometimes in leads aVR and V1.
Patients with an acute MI also have concurrent ST-T wave changes. T wave inversions may be present that are not typical findings in acute pericarditis. Also, the evolution of repolarization takes place more slowly and asynchronously in acute pericarditis compared to acute MI.
Acute pericarditis presents with PR depression in all leads except aVR. This is not seen in MI. PR depression is caused by an atrial current of injury in acute pericarditis.
The frontal axis of the ST vectors in acute pericarditis is between +30° and +70°. The ST segment elevation in leads I, II, and aVF is not seen with MI. In contrast, an inferior wall MI has frontal axis ST vectors between +80° and +120°. In anterior MI, the frontal axis of the ST vectors is between +10° and −40°, particularly if the the MI is extensive.
Hyperacute T waves, new pathologic Q waves, and QT prolongation are more common in STEMI than in acute pericarditis.
A classical Stork leg sign is specific for acute pericarditis. There is a short, upward deflection (< 1 mm) at the J point. When the QRS complex is flipped vertically, it resembles a stork standing on one leg. This image is drawn by the inverted R wave; the ST elevation on the J point produces the image of the retracted leg. The stork-leg sign is typically seen in precordial leads V4 through V6 in approximately 40% of patients with acute pericarditis.

Acute Pericarditis ECG Rhythms
The ECG above is from a patient with acute pericarditis. PR depressions and ST elevations are seen in almost all the ECG leads, the frontal QRS axis of the ST vectors is +30°, a stork leg sign appears in leads V4 through V6 , and there is an ST elevation to T wave ratio of 0.33 in lateral lead V6 .
Table 0-2. Acute pericarditis and STEMI.
Acute Pericarditis vs. Benign Early Repolarization
Benign early repolarization (BER) is present in up to 30% of young adults. The ECG findings in BER can be confused with acute pericarditis. BER is characterized by minute ST elevations at the J point, and the ST segment may appear to have a stork leg sign in lead V4 . BER morphology is seen in the anterior and lateral chest leads V3 through V6 .
- ST elevation
- Present in both the limb leads and precordial leads in acute pericarditis
- Only half of patients with BER have ST elevations in the limb leads
- PR deviations and the evolution of ST and T wave changes favor the diagnosis of pericarditis, especially if the clinician hears a pericardial friction rub on auscultation.
- An ST/T wave amplitude ratio > 0.24 mm in lead V6 favors the diagnosis of acute pericarditis.
BER can occur in the setting of pericarditis, such as in the ECG example below.

Benign Early Repolarization With Acute Pericarditis ECG 25
The ECG tracing above is from a patient who may have acute pericarditis along with benign early repolarization (BER).
- Widespread concave ST elevation suggests pericarditis.
- Significant ST elevations in precordial leads V2 through V5 suggest BER.
- The downsloping PR depression in limb leads I and aVL and precordial leads V3 through V6 suggest pericarditis.
- A stork leg sign only seen in lead V4 suggests BER.
- Prominent T waves in the precordial leads and an ST/T ratio in V6 of only 0.16 suggests BER.
Since these findings are consistent with both BER and acute pericarditis, the clinician must correlate the ECG tracing with old ECGs when available, serial ECGs, and clinical findings.

Benign Early Repolarization Identified by Widespread Minor ST Elevation and Stork Leg Sign ECG 26
25 Burns E, Buttner R. Pericarditis. Life in the fastlane website. Accessed April 27, 2021.
https://litfl.com/wp-content/uploads/2018/08/ECG-Pericarditis-or-BER.jpg
26 Burns E, Buttner R. Pericarditis. Life in the fastlane website. Accessed April 27, 2021.
ps://litfl.com/wp-content/uploads/2018/08/ECG-Pericarditis-or-BER.jpg