Localization of Q Wave Infarction
The ECG morphologies of an infarction manifest according to the lesion’s location. The limb leads represent the frontal plane (leads I, II, III, aVR, aVL, and aVF). The frontal plane assesses the superior, inferior, medial, and lateral aspects of the heart.
The precordial leads, V1 through V6, visualize the transverse plane. The transverse plane assesses the anterior, posterior, medial, and lateral aspects of the heart, with some limitations because lead placement is predominantly on the left ventricle.
By combining the two planes, a 12-lead ECG lets the clinician identify the affected segments of the left ventricle. Once the clinician identifies the location of the infarct, it can then be approximated which coronary artery may have been occluded.
The left and right coronary arteries branch out from the root of the aorta. The left coronary artery branches into the left anterior descending artery and the left circumflex artery. The left anterior descending artery supplies the intraventricular septum and the anterior aspect of the left ventricle.
The left circumflex artery supplies the left ventricular free wall, i.e., the lateral aspect of the heart. Sometimes the left coronary artery has collaterals that supply the posterior descending artery. The posterior descending artery supplies the posterior and inferior aspects of the left ventricle.
The right coronary artery branches out to the posterior descending artery and the marginal branches. The posterior descending artery supplies the posterior and inferior aspects of the left ventricle. The marginal branches of the right coronary artery supply the right ventricle.

The Coronary Arteries
Anteroseptal Infarction
An anteroseptal infarction involves the intraventricular septum and the apex of the heart. Leads V2 and V3 are placed over the intraventricular septum, while lead V4 is placed over the apex. Lead V1 may also show infarct morphologies since it is close to the intraventricular septum.

Anteroseptal Infarction and Corresponding Precordial ECG Leads V1, V2, V3, and V4
12-Lead ECG and Vectorcardiogram Analysis of Anteroseptal MI
Anteroseptal wall MI is better evaluated in the precordial leads V1 through V6 (see figure 11). The vectorcardiograph of a 61-year-old male with a chronic anteroseptal wall MI is shown below alongside the vectorcardiography of a healthy patient.
Since the heart of the patient with an MI has considerable necrotic tissue, chronic MI is represented by a QS wave. The patient with MI also has a QRS loop that no longer resembles a loop because the QRS waves are all in one vector, representing the QS complex. Whereas the healthy patient’s QRS loop first moves anteriorly, migrates toward the left ventricle, then moves posteriorly before forming the T Loop.
Since the T loop of the vectorcardiogram of the patient with an MI moves posteriorly, an inverted T wave appears in leads V1 through V4. As previously discussed, chronic MI has vectors moving away from the site of injury and necrosis. The QS complex in leads V1 through V4 represents an anteroseptal infarction.
ECG findings of an anteroseptal wall MI are not appreciated within the limb leads because they represent the frontal plane of the vectorcardiogram.

A vectorcardiogram of the transverse plane of (a) a healthy individual and (b) a patient with anteroseptal wall MI as well as the frontal plane of (c) a healthy individual and (d) a patient with anteroseptal wall MI.

A vectorcardiogram of the transverse plane of (a) a healthy individual and (b) a patient with anteroseptal wall MI as well as the frontal plane of (c) a healthy individual and (d) a patient with anteroseptal wall MI.

A vectorcardiogram of the transverse plane of (a) a healthy individual and (b) a patient with anteroseptal wall MI as well as the frontal plane of (c) a healthy individual and (d) a patient with anteroseptal wall MI.

A vectorcardiogram of the transverse plane of (a) a healthy individual and (b) a patient with anteroseptal wall MI as well as the frontal plane of (c) a healthy individual and (d) a patient with anteroseptal wall MI.
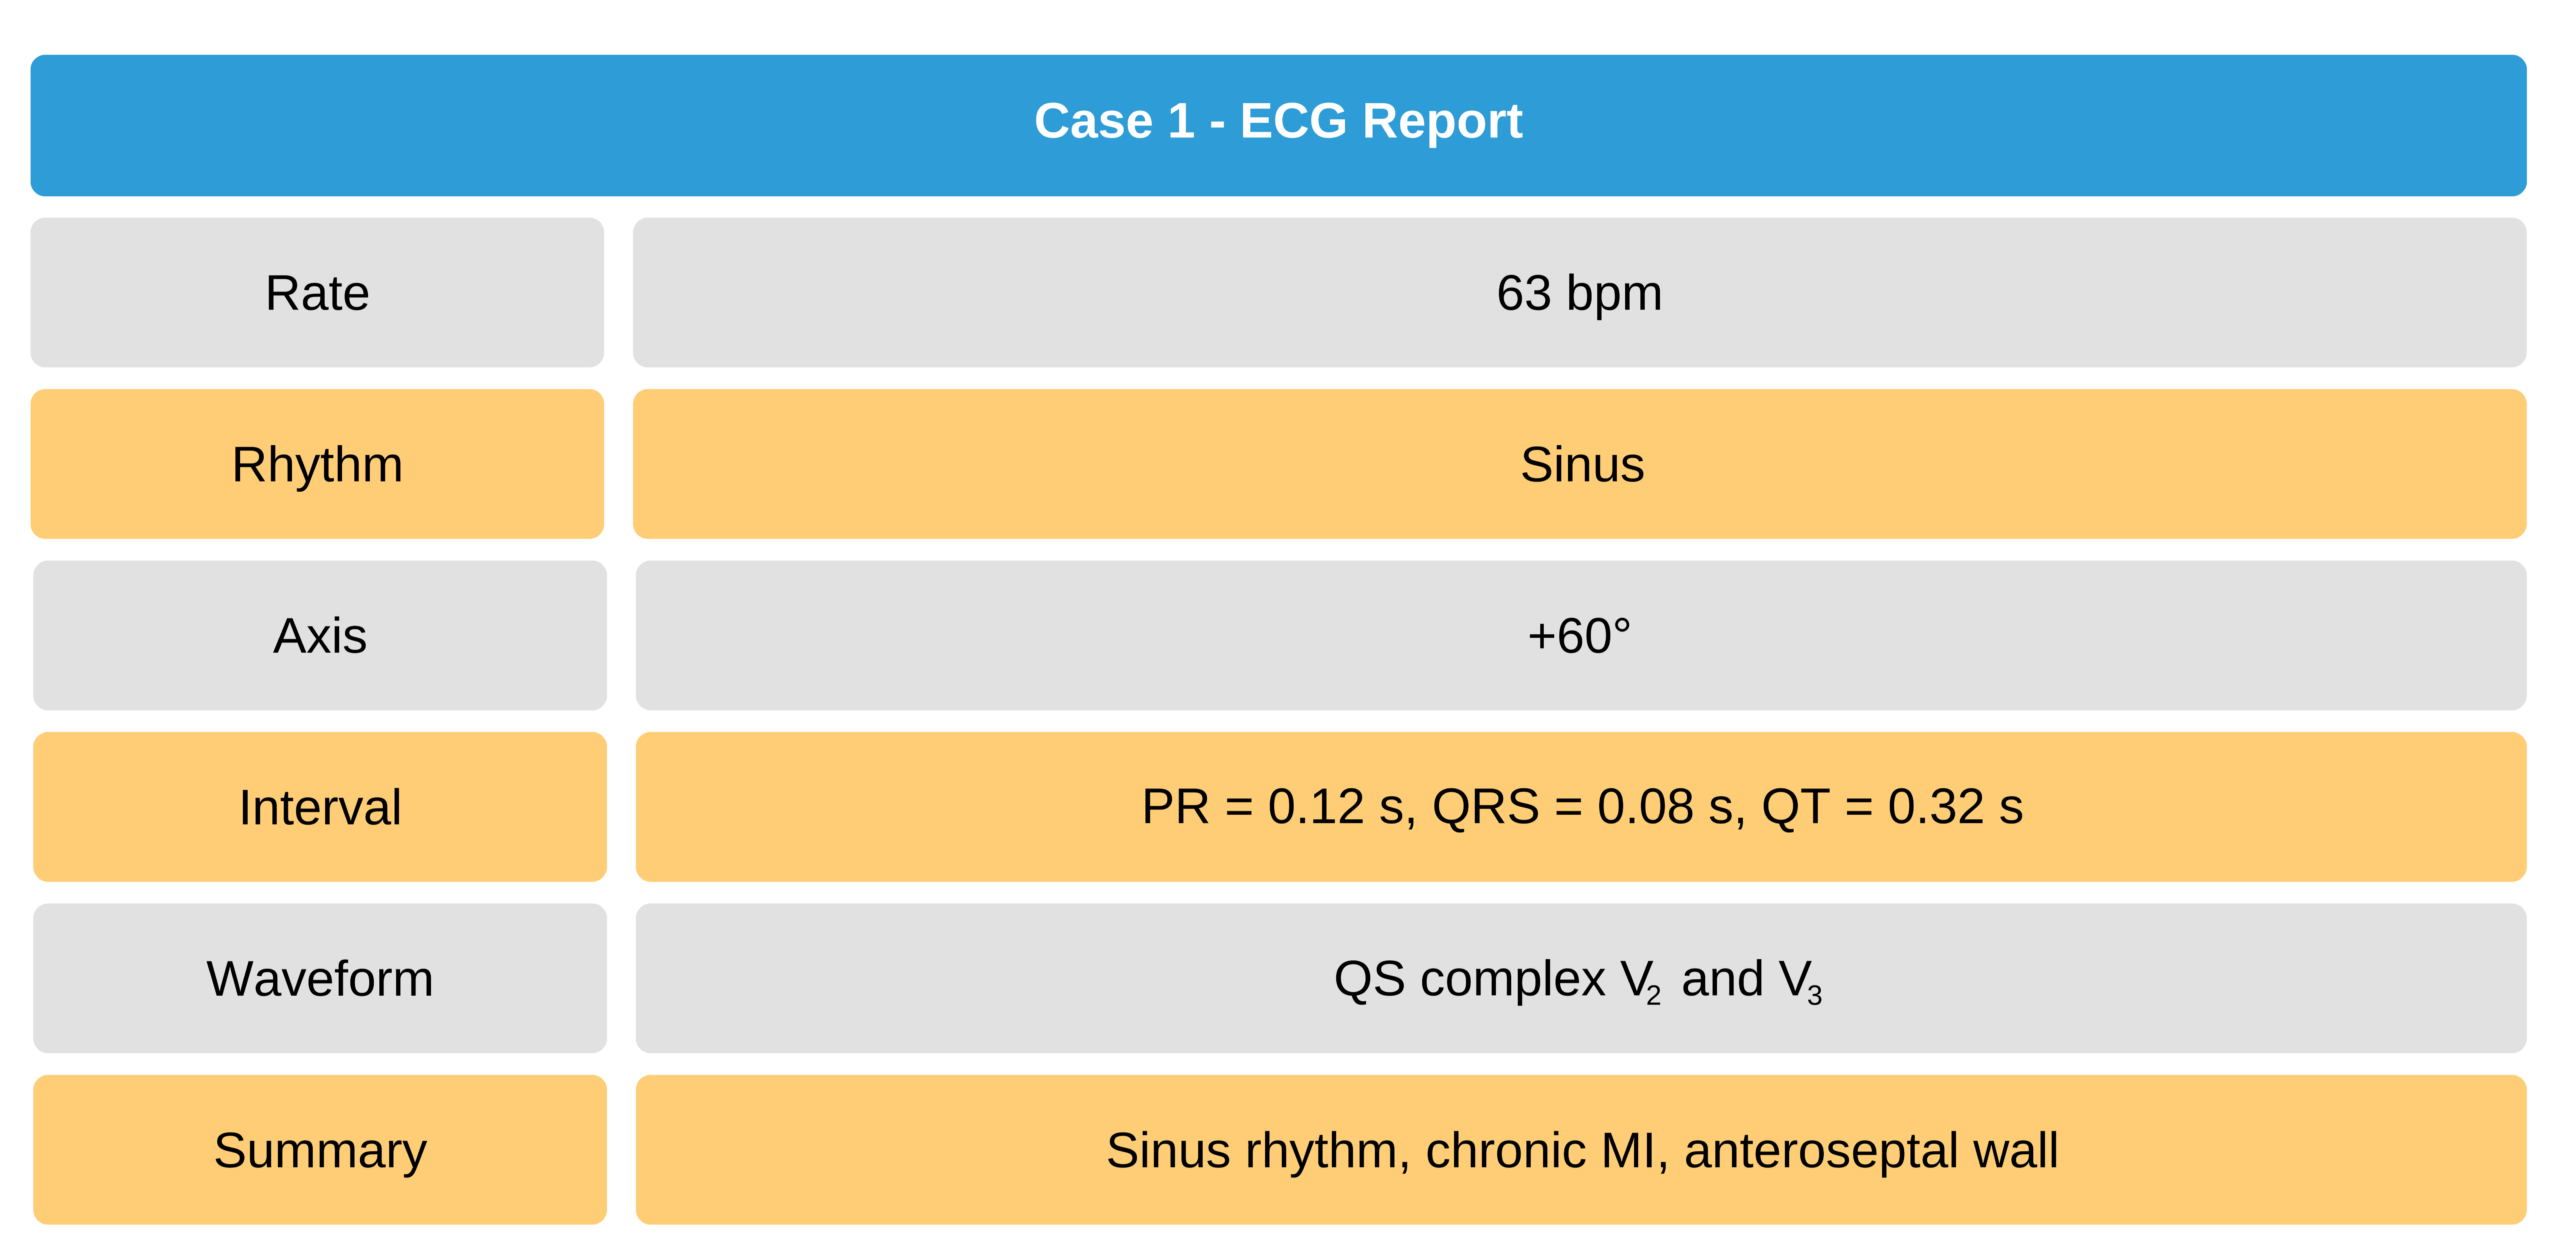
Case 1
A 57-year-old man with a previous history of coronary artery disease.

57-Year-Old Man With Coronary Artery Disease ECG
Extensive Anterior Infarction (Anterolateral Infarction)
An extensive anterior infarction includes the septum, apex, and lateral walls of the left ventricle. These regions of the heart correspond to leads V2 through V4 and sometimes V1 as well. V5 and V6 commonly detect change in an anterolateral infarction as well. If the superolateral (high lateral) portion of the left ventricle has a lesion, frontal leads I and aVL may also detect the MI.

Extensive Anterior Infarction
12-Lead ECG and Vectorcardiogram Analysis of Anterolateral MI
The figure below shows a side-by-side comparison of the ECG and vectorcardiogram of a 75-year-old man with known two-vessel CAD and a healthy patient. The healthy individual has a clockwise rotation of the vectors in the transverse plane.
In contrast, the vectors in the transverse plane of the patient with CAD move counter-clockwise and have generated QS complexes in leads V2 and V3 along with inverted T waves in all of the precordial leads.
The frontal axis shows a clockwise rotation of the vectors, resulting in inverted T waves in lead aVL. The healthy patient has a counterclockwise rotation of the vectors in the frontal axis (see figure below).

A vectorcardiogram of the transverse plane of (a) a healthy individual and (b) a patient with anterolateral wall MI as well as the frontal plane of (c) a healthy individual and (d) a patient with anterolateral wall MI.

A vectorcardiogram of the transverse plane of (a) a healthy individual and (b) a patient with anterolateral wall MI as well as the frontal plane of (c) a healthy individual and (d) a patient with anterolateral wall MI.
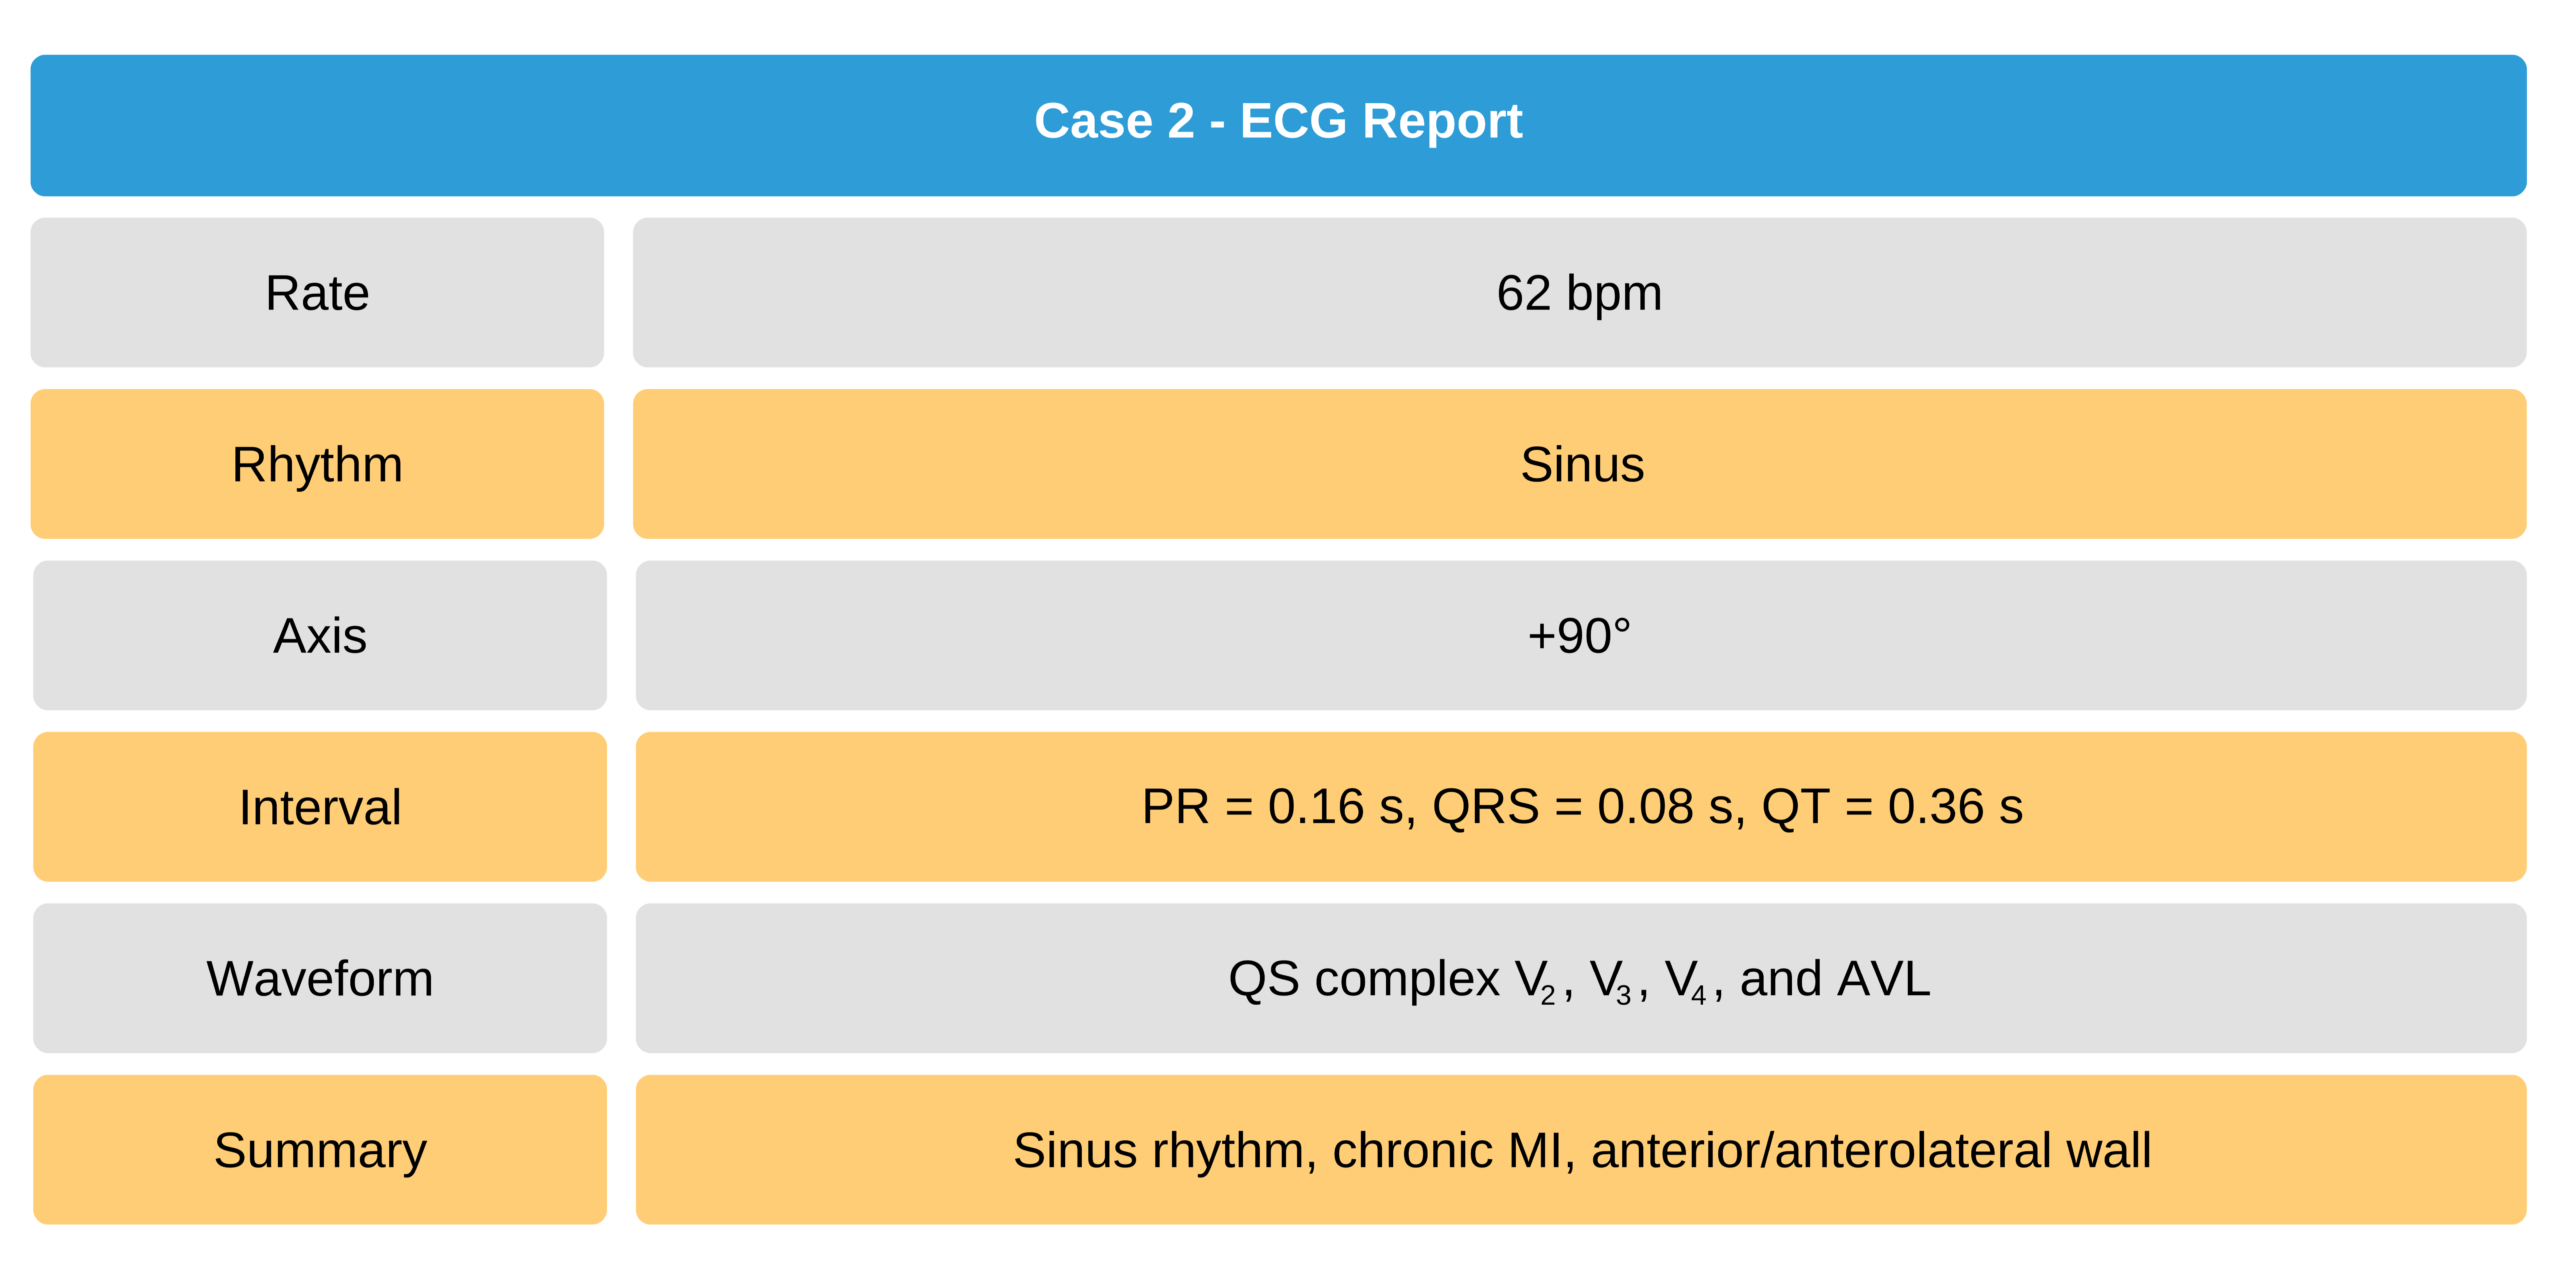
Case 2
A 48-year-old man with a history of coronary artery disease.

48-Year-Old Man With Coronary Artery Disease ECG
Lateral Infarction
The lateral wall infarction, due to rarity, is often overlooked. An isolated lateral infarction should manifest in leads V5 and V6. A high lateral wall MI may also manifest in leads I and aVL.

Lateral Wall Infarction
12-Lead ECG and Vectorcardiogram Analysis of Isolated Lateral MI
A 12-lead ECG with the corresponding vectorcardiogram from a 52-year-old woman with known one-vessel CAD is shown below and compared with a healthy individual. The ECG reports a chronic lateral wall MI. There are pathologic q waves in leads V5 and V6.
The vectorcardiogram in the transverse plane of a healthy individual shows a counterclockwise rotation. The vectorcardiogram in the 52-year-old with a chronic lateral wall MI shows a clockwise rotation in the transverse plane. The Q vectors are sharply directed anteriorly and to the right, away from V5 and V6.
This is an electrophysiological phenomenon of the site of tissue necrosis where pathologic Q waves are reflected on the ECG.

A vectorcardiogram of the transverse plane of (a) a healthy individual and (b) a patient with chronic lateral wall MI as well as the frontal plane of (c) a healthy individual and (d) a patient with chronic lateral wall MI.

A vectorcardiogram of the transverse plane of (a) a healthy individual and (b) a patient with chronic lateral wall MI as well as the frontal plane of (c) a healthy individual and (d) a patient with chronic lateral wall MI.
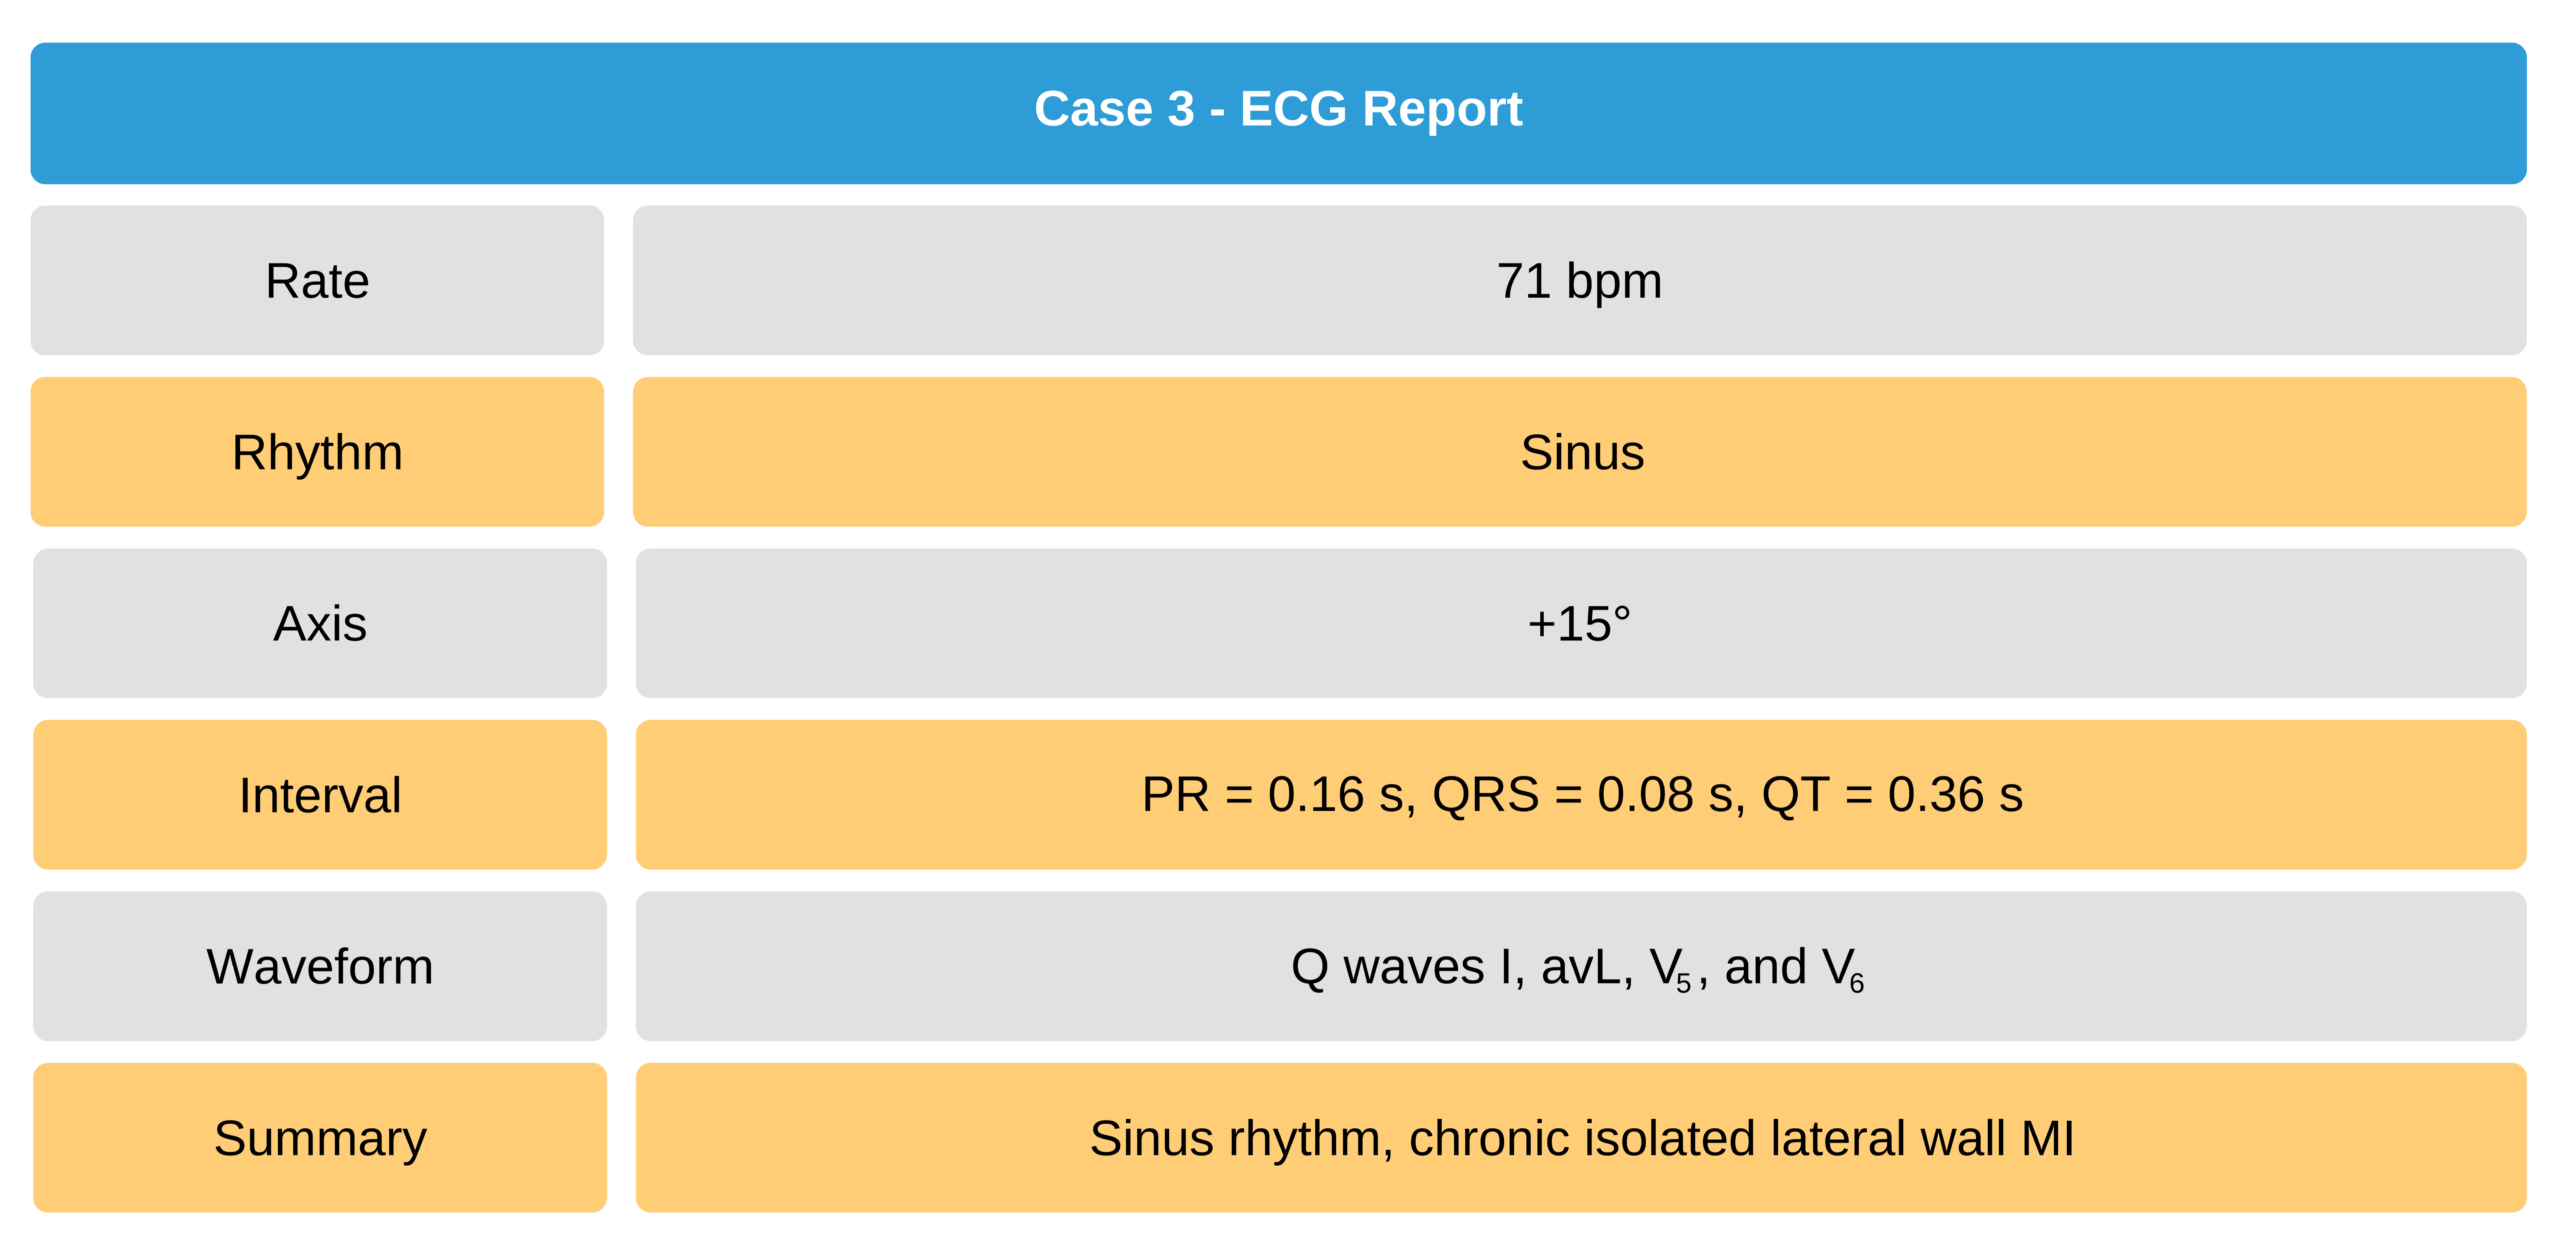
Case 3
A 12-lead ECG from a 30-year-old man with a chronic isolated lateral wall MI.

30-Year-Old Man Chronic Isolated Lateral Wall MI ECG
Inferior Wall Myocardial Infarction
Leads II, III, and aVF reflect vectors oriented in the inferior walls. ECG findings of inferior wall infarction reflect in these leads. The most common manifestations are seen in leads III and aVF, and indicators may appear less distinct in lead II. A q wave in lead II is likely a result of an inferior infarction.
An inferior infarction may also be associated with a right ventricular infarction since the affected coronary vessel supplies both regions of the heart.

Inferior Wall Myocardial Infarction
12-Lead ECG and Vectorcardiogram Analysis of an Isolated Inferior MI
The 12-lead ECG and vectorcardiogram below were taken from a 60-year-old man with two-vessel CAD. The patient shows an akinetic inferobasal wall on ventriculography, and the 12-lead ECG indicates chronic inferior wall MI. The vectorcardiogram of the frontal plane shows vectors moving counterclockwise. Sharp Q vectors move superiorly and to the right, moving away from the site of necrosis. Corresponding pathologic Q waves appear in leads II, III, and aVF. The T loop vectors travel in a clockwise direction, which results in inverted T waves in the inferior leads. The T loop in the healthy patient travels counterclockwise as well.

A vectorcardiogram of the transverse plane of (a) a healthy individual and (b) a patient with chronic inferior wall MI as well as the frontal plane of (c) a healthy individual and (d) a patient with chronic inferior wall MI.

A vectorcardiogram of the transverse plane of (a) a healthy individual and (b) a patient with chronic inferior wall MI as well as the frontal plane of (c) a healthy individual and (d) a patient with chronic inferior wall MI.

A vectorcardiogram of the transverse plane of (a) a healthy individual and (b) a patient with chronic inferior wall MI as well as the frontal plane of (c) a healthy individual and (d) a patient with chronic inferior wall MI.

A vectorcardiogram of the transverse plane of (a) a healthy individual and (b) a patient with chronic inferior wall MI as well as the frontal plane of (c) a healthy individual and (d) a patient with chronic inferior wall MI.
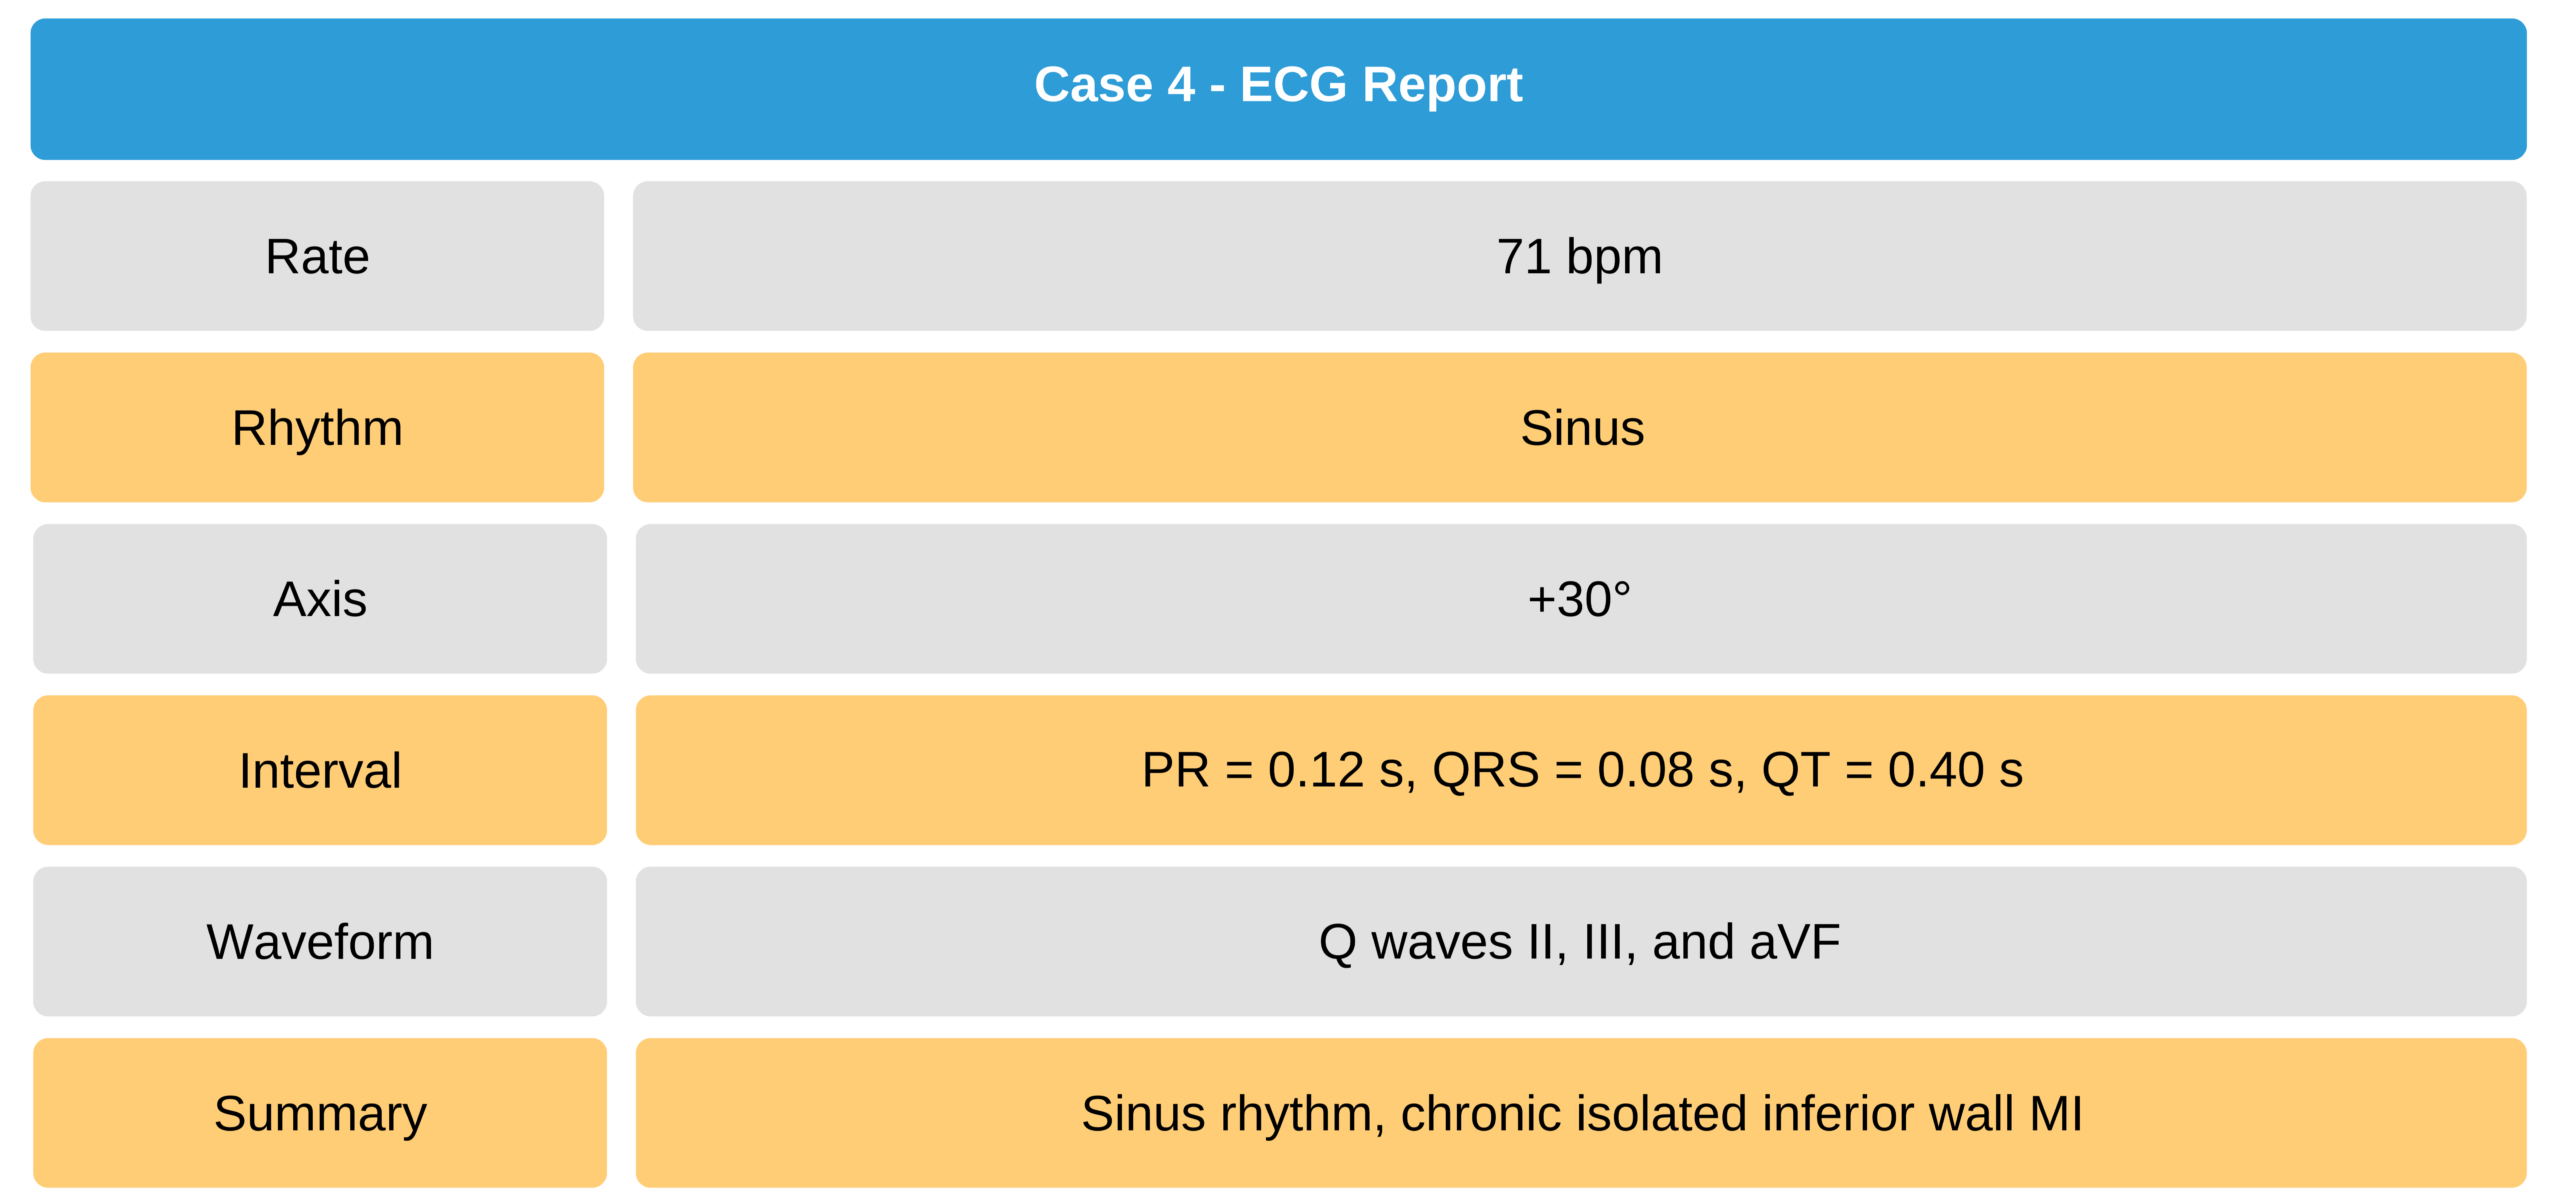
Case 4
12-lead ECG and vectorcardiogram from a 60-year-old man with two-vessel CAD, akinetic inferobasal wall on ventriculography, and a 12-lead ECG showing chronic inferior wall MI.

60-Year-Old Man With Chronic Inferior Wall MI ECG
Posterior Wall Myocardial Infarction
A poster wall infarction is one of the most difficult to detect in a 12-lead ECG. Due to the location of precordial leads V1 through V6, the electrophysiological findings denoting posterior wall MI are the mirror image of the original pattern. This mirror image can be seen in leads V2, V3, and sometimes V1 and consists of ST elevation, ST depression, and broad R waves instead of pathologic Q waves and QS complexes.
When a posterior wall MI is suspected, it is imperative to perform a 15-lead ECG, adding leads V7 through V9, which provides a direct infarction pattern for posterior wall MI. Signs to look for in the 15-lead ECG are:
- A single R wave and/or Rs complex, with an R duration > 0.04 seconds
- Isolated ST depression
- A combination of 1 and 2
An Rs complex (broad R wave ≥ 0.04 seconds) in leads V1 through V3 can be seen in normal ECG tracings in young, healthy patients, but isolated ST depression in these leads is often pathologic and suggests acute posterior MI. Anatomical imaging modalities such as 2-D echocardiography can be used to detect abnormal posterior wall motion and confirm the diagnosis of posterior wall MI.

Lead Placement of V7 Through V9 19

Isolated Posterior Wall Infarction
12-Lead ECG and Vectorcardiogram Analysis of Isolated Inferior MI
The vectorcardiogram below is from a 56-year-old woman with hypertension and dyslipidemia. The Q wave has a more forward direction when compared to a healthy patient and is characteristic of a chronic posterior wall MI. The sagittal view further demonstrates the anterior and posterior direction of the vectors (see figure below).

A vectorcardiogram of the transverse plane of (a) a healthy individual and (b) a patient with chronic posterior wall MI as well as the frontal plane of (c) a healthy individual and (d) a patient with chronic posterior wall MI.

A vectorcardiogram of the transverse plane of (a) a healthy individual and (b) a patient with chronic posterior wall MI as well as the frontal plane of (c) a healthy individual and (d) a patient with chronic posterior wall MI.

A vectorcardiogram of the transverse plane of (a) a healthy individual and (b) a patient with chronic posterior wall MI as well as the frontal plane of (c) a healthy individual and (d) a patient with chronic posterior wall MI.

A vectorcardiogram of the transverse plane of (a) a healthy individual and (b) a patient with chronic posterior wall MI as well as the frontal plane of (c) a healthy individual and (d) a patient with chronic posterior wall MI.
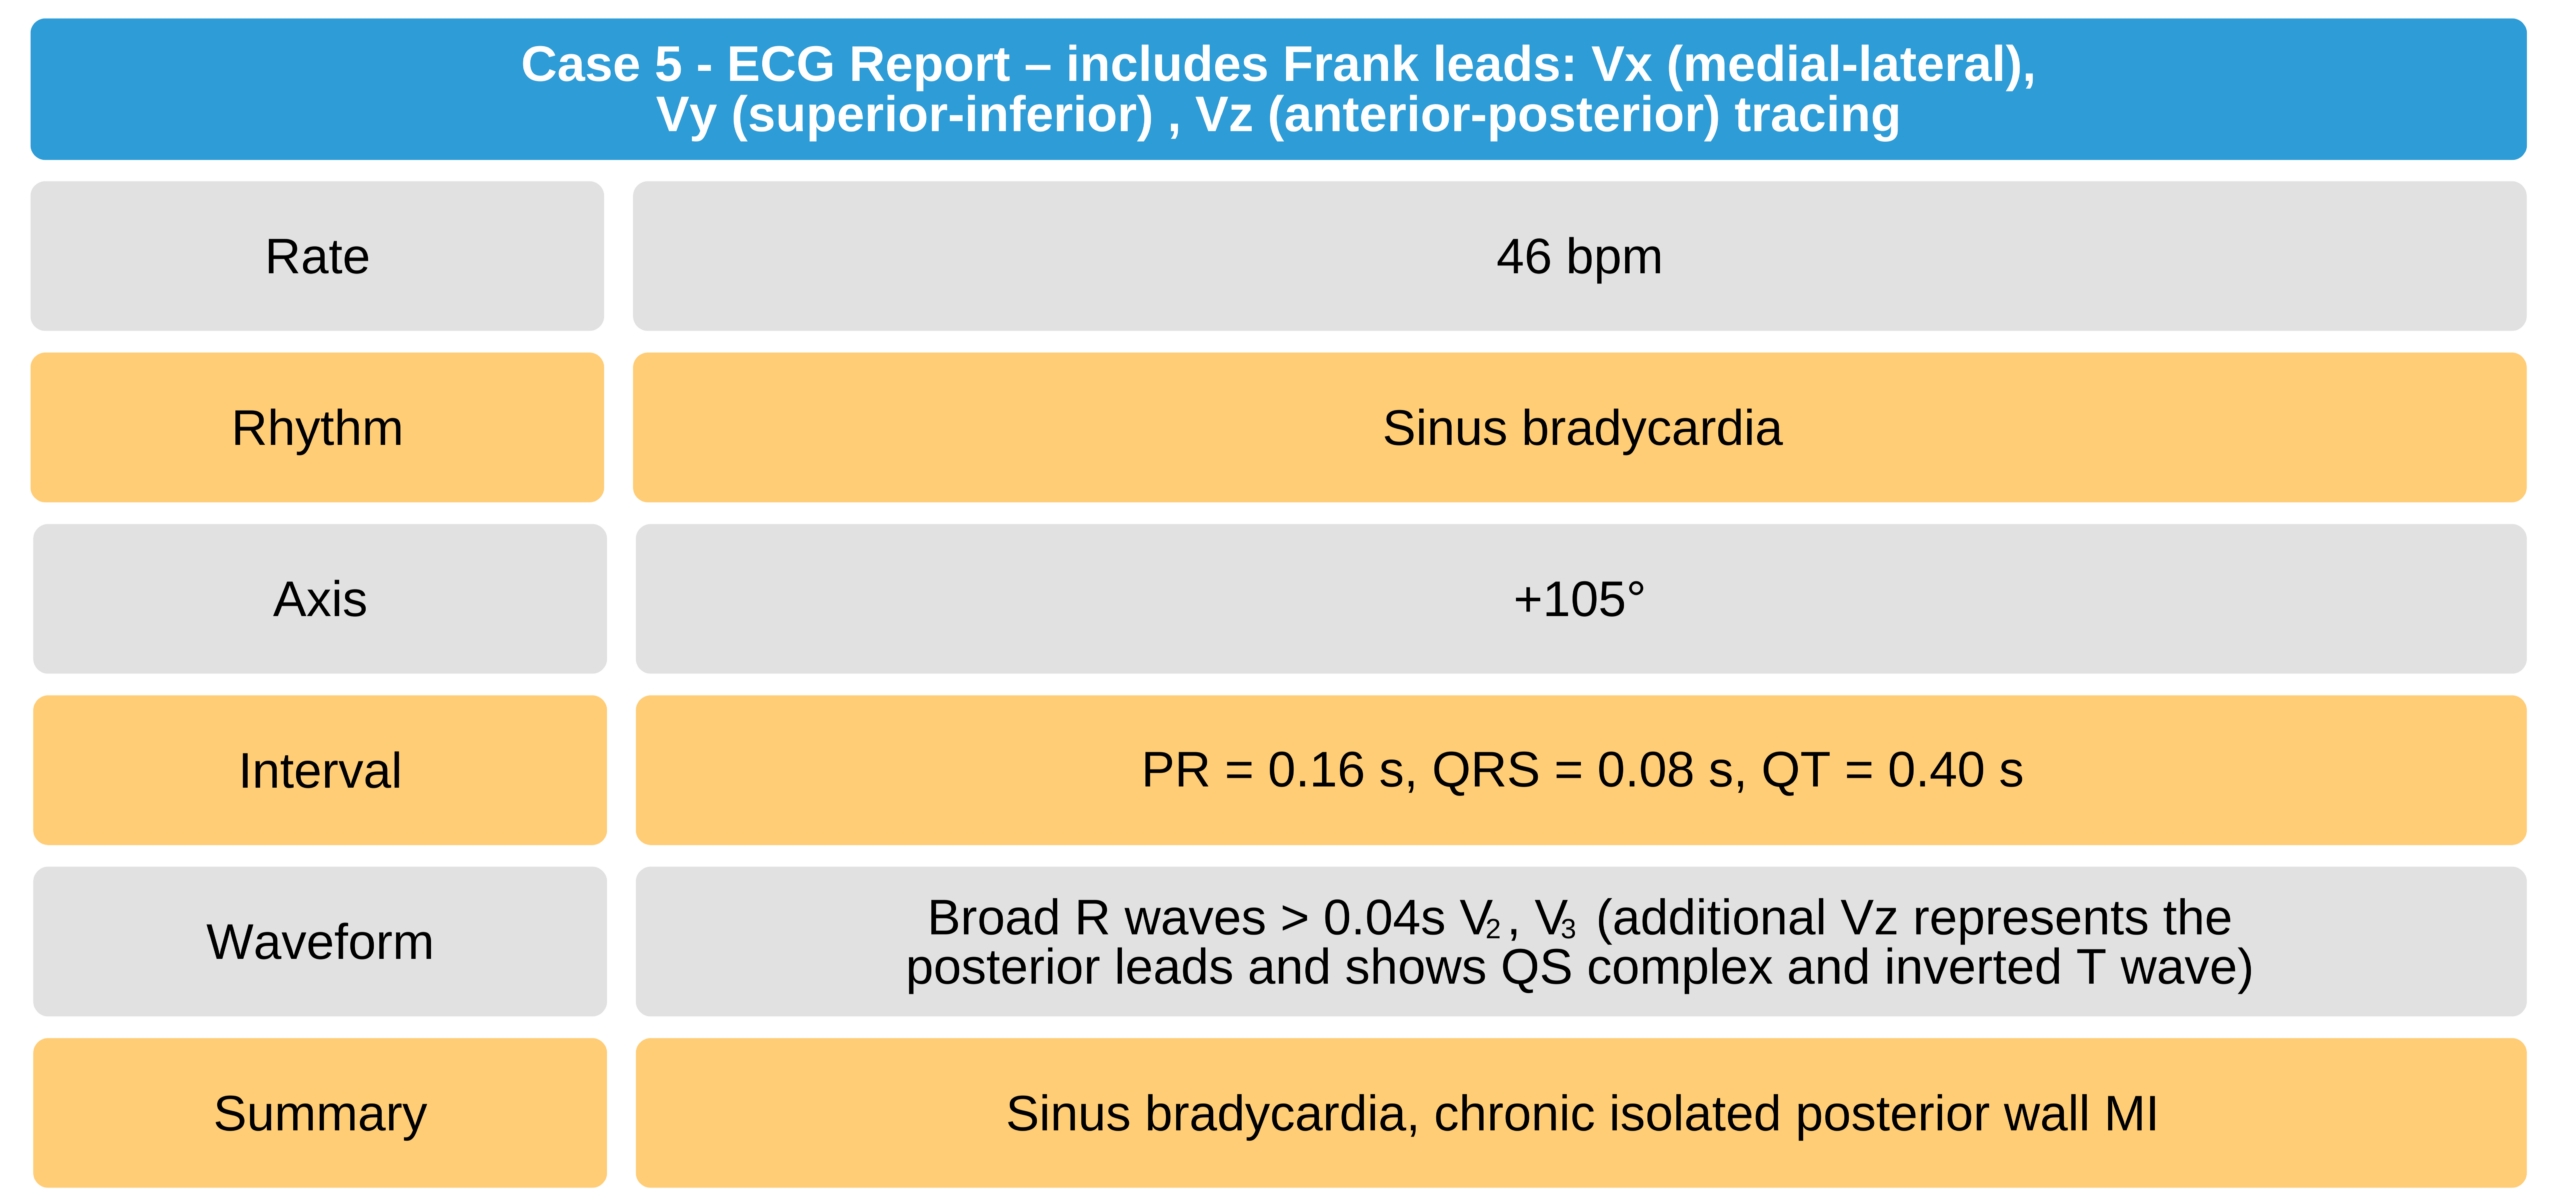
Limb leads V2 and V3 (see figure below) show broad R waves of > 0.4 seconds in duration. A vertical mirror image of leads V2 and V3 reveals deep Q waves, ST segment elevation, and an inverted T wave, confirming the diagnosis. Note that limb lead V4 may have been misplaced superiorly and medially, which reflects the same ECG pattern of lead V3. A complete 12-lead ECG tracing with additional Vx, Vy, and Vz leads of this patient is presented in Case 5.

Mirror Image of Leads V2 and V3

Mirror Image of Leads V2 and V3

Mirror Image of Leads V2 and V3

Mirror Image of Leads V2 and V3
Case 5
ECG of a 56-year-old woman with hypertension and dyslipidemia, with chronic true posterior wall MI.

56-Year-Old Woman With Chronic True Posterior Wall MI ECG
Right Ventricular Infarction
Right ventricular infarction is extremely rare. In contrast with a true posterior infarction, right ventricular infarction does not manifest in a mirror image of any of the 12 leads. It is only captured if additional right ventricular leads are placed (V3R, V4R, V5R, and sometimes V6R).

Right Ventricular Lead Placements
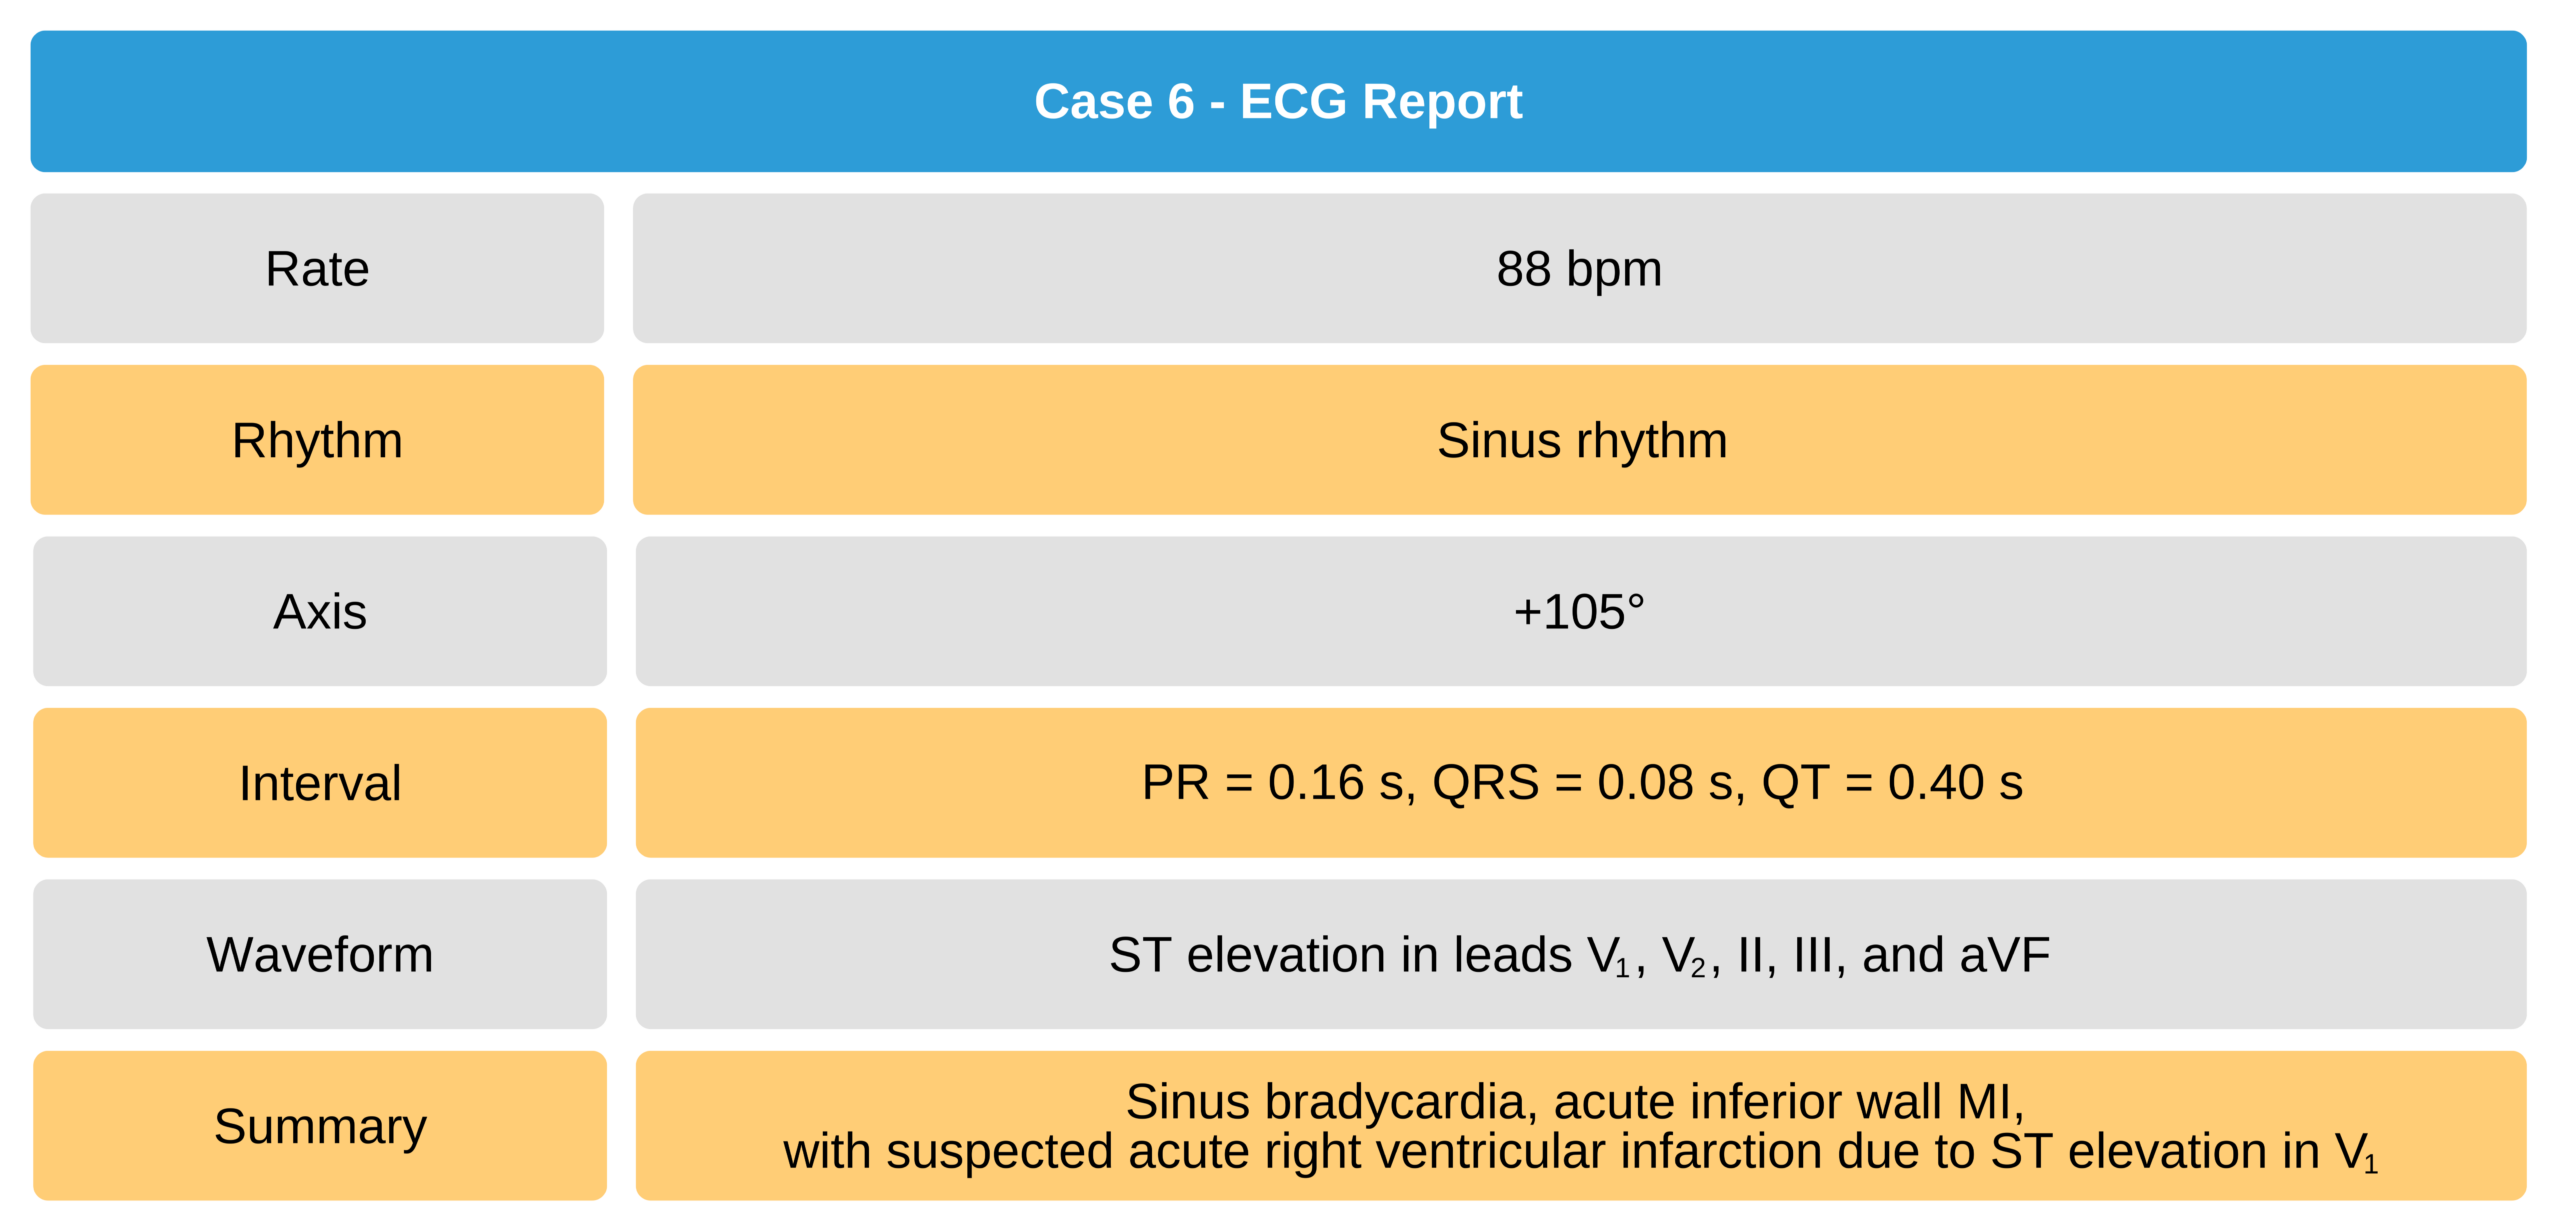
An acute inferior wall MI can occur on top of an acute right ventricular MI. Both areas are perfused by the right coronary artery. A right ventricular MI is often associated with an AV block.
Patients suspected of having acute right ventricular MI secondary to an acute inferior wall MI must have right ventricle leads V3R through V6R applied as soon as possible.
The therapeutic regimen differs once an acute right ventricular MI is documented. The treatment of choice is immediate percutaneous transluminal coronary angiography. Thrombolysis is a second therapeutic option.
The ECG findings of right ventricular MI often disappear within 48 hours from the onset of symptoms. In some patients, it is not detectable in the ECG 1 week after the onset of symptoms. Due to this phenomenon, some studies suggest that RV infarcts represent reversible ischemia rather than a true infarction. This is an example of the hibernating myocardium phenomenon.

Right Ventricular Myocardial Infarction
Case 6

Acute Right Ventricular Infarction ECG
 Survey lead V4R was applied, and ST elevation was detected in V4R, confirming the diagnosis of acute right ventricular infarction.20.21

Acute Right Ventricular Infarction ECG 2
19 Burns E. Posterior myocardial infarction. Life in the fastlane website. Accessed April 25, 2021.
https://litfl.com/wp-content/uploads/2018/08/Posterior-leads-V7-V8-V9-ECG-placement-768×614.jpg
20 Burns E, Buttner R. Right ventricular infarction. Life in the fastlane website. Accessed April 25, 2021.
https://litfl.com/wp-content/uploads/2018/08/ECG-Right-ventricular-infarction-1-1024×421.jpg
21 Burns E, Buttner R. Right ventricular infarction. Life in the fastlane website. Accessed April 25, 2021.
https://litfl.com/wp-content/uploads/2018/08/ECG-Right-ventricular-infarction-1b-V4R-1024×534.jpg