P Wave
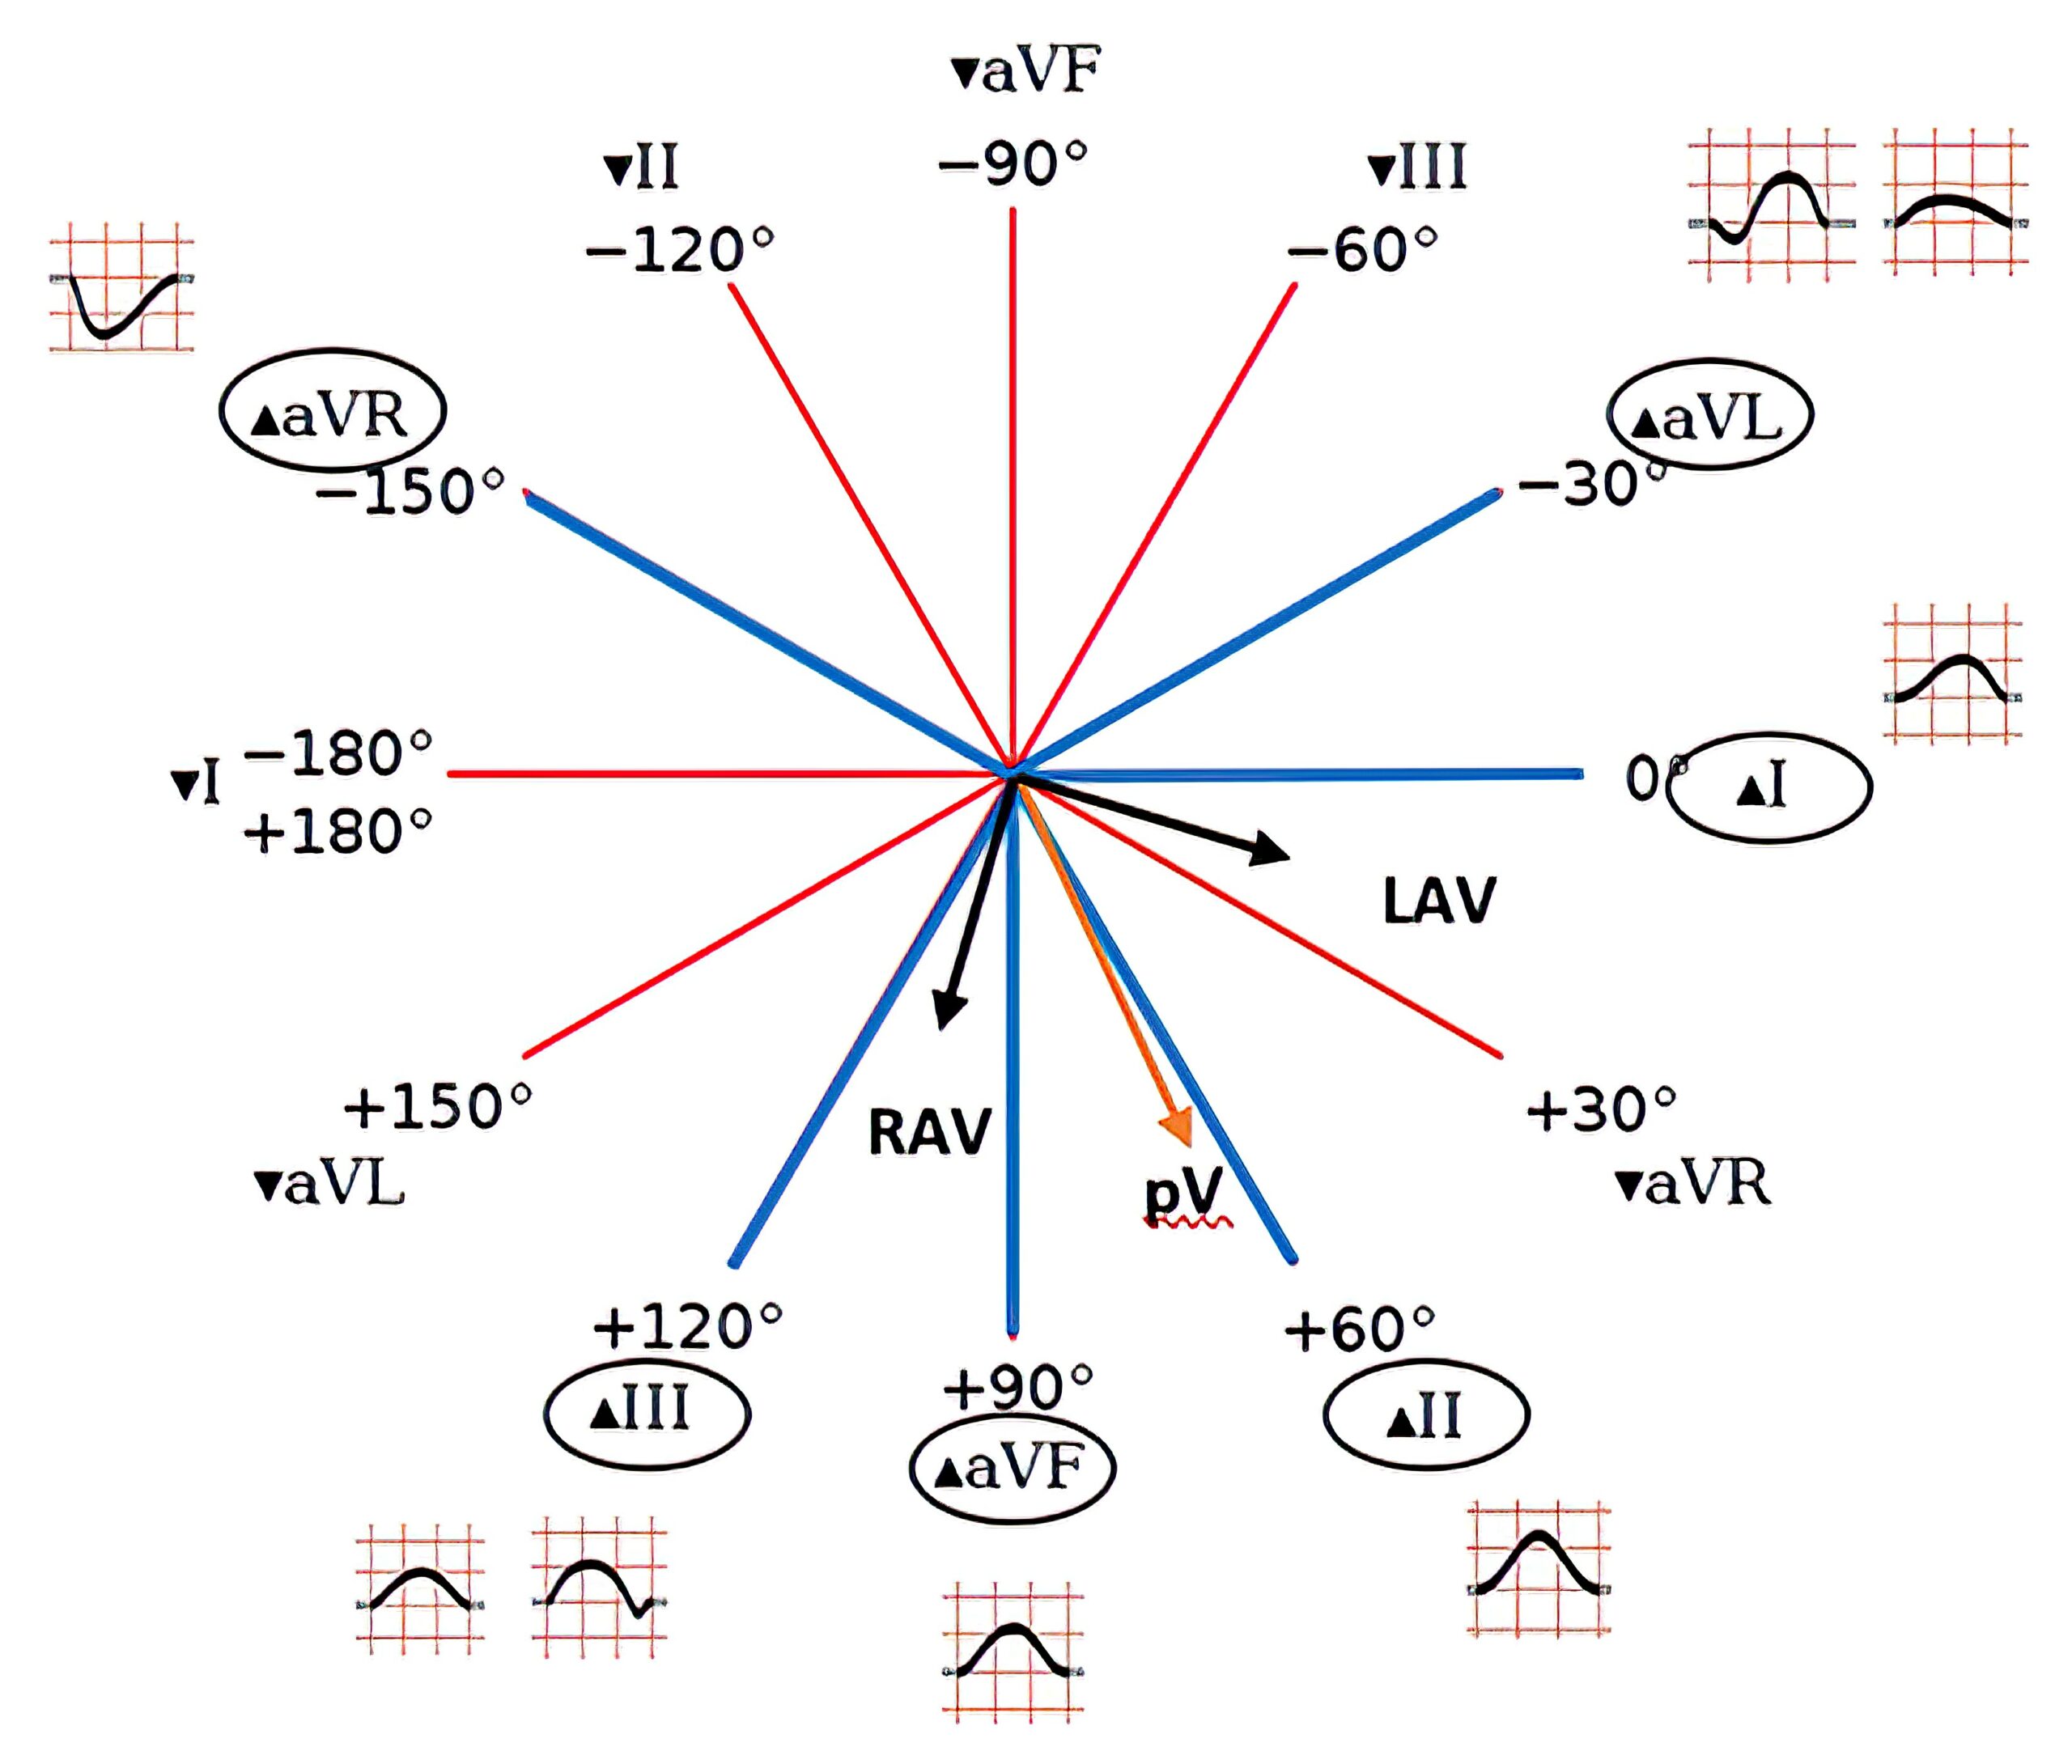
The normal cardiac rhythm is produced by impulses that originate from the sinus node. Figure 2 represents the frontal plane axis and showcases the P vector and the P wave morphology in the different limb leads.
P Wave in the Frontal Plane
Vectors that originate from the sinoatrial node form the P vector.
- Impulses from the SA node in the right atrium produce the right atrial vector.
- After 0.20 seconds, impulses from the left atrium produce the left atrial vector.
- The right and left atrial vectors fuse together to form the p-vector.
The P vector determines P wave morphology in the different limb leads of the 12-lead ECG.
- The normal duration of the P wave is 0.09 to 0.11 seconds.
- Lead II is the best place to measure the P wave because it is completely visualized in this lead from beginning to end.
- The P wave has a positive deflection in all leads except aVL and aVR.
- The P wave in aVL exhibits a biphasic morphology.
- The P wave in aVR is completely downwards.
- The P wave may also be bi-phasic in lead III if the P vector projects away from that lead.

Figure 2. The frontal plane axis showcasing the right and left atrial vectors, resulting P vector, and the corresponding P wave morphology.
P Wave in the Horizontal Plane
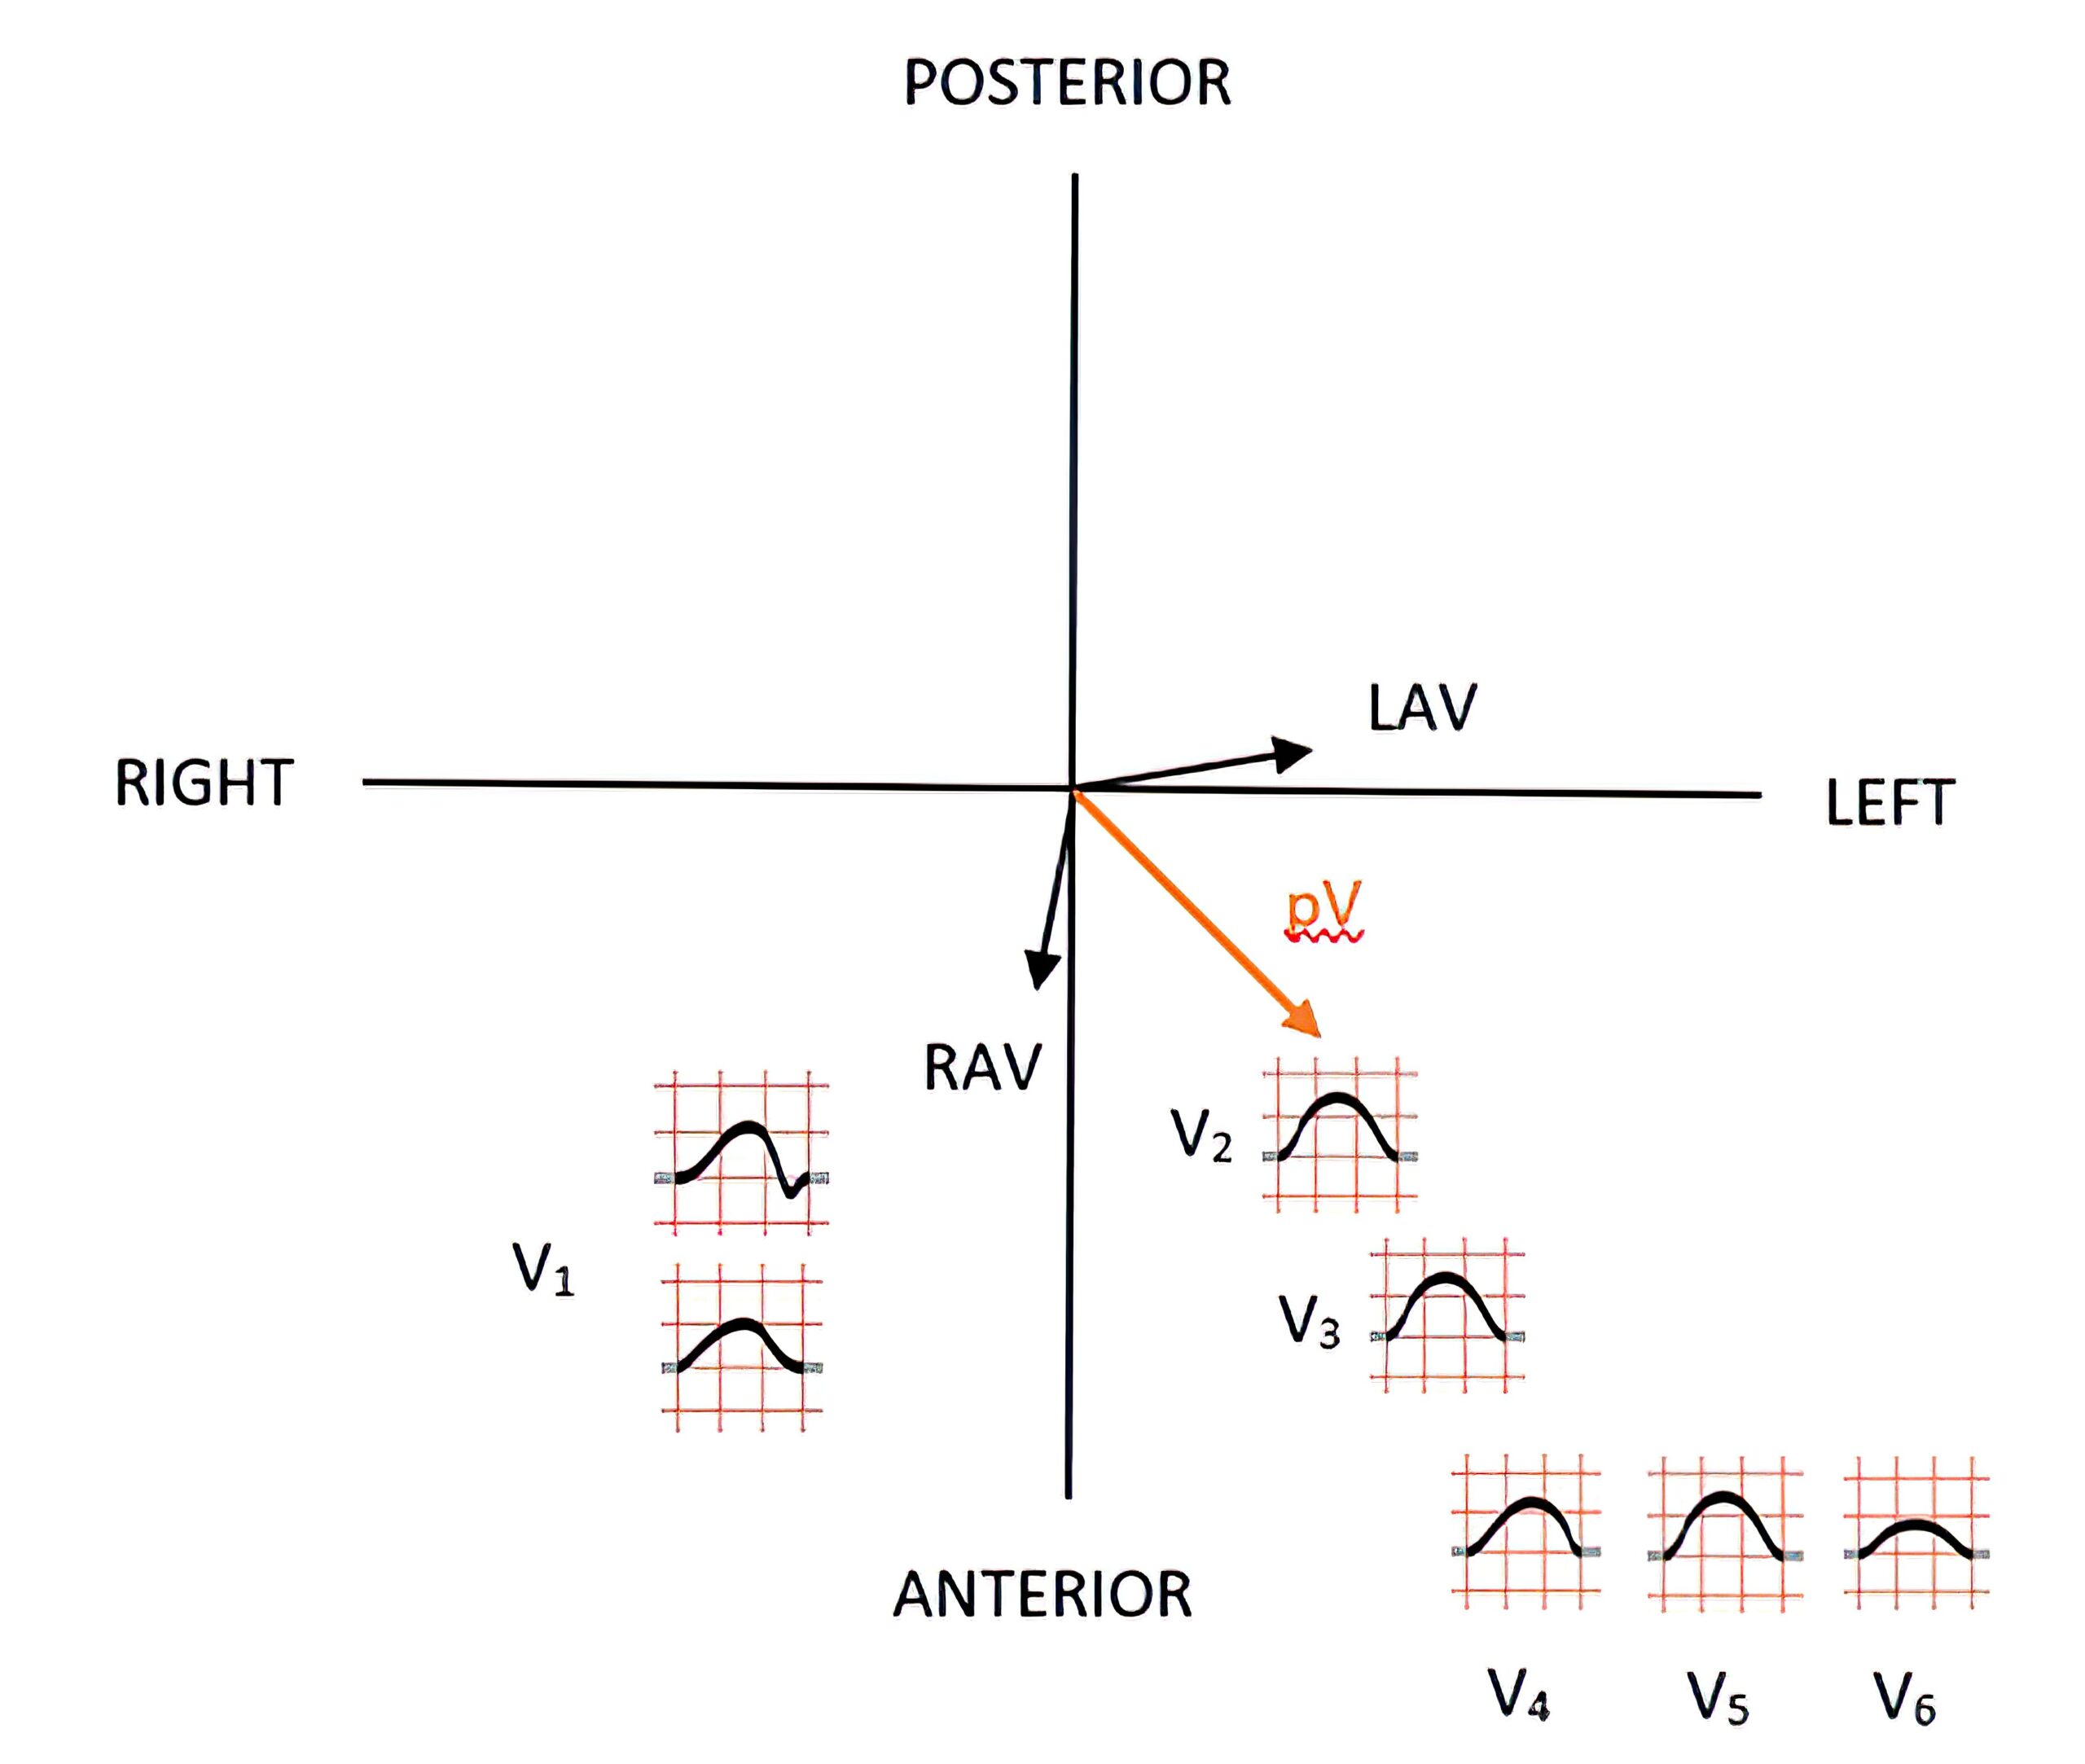
Figure 3 depicts the projection of the right and left atrial vectors and the resulting P vector in the horizontal plane. The resulting P wave morphology on each chest lead in this plane is shown as well.
In the horizontal plane, the biphasic P wave morphology is only seen in lead V1 because some of the impulses from the P vector travel away from it, influenced by the left atrial vector. Leads V2 through V6 have P waves with a positive projection.

Figure 3. Horizontal Plane With Vector Projections