Electrocardiography – Waves, Complexes, Segments, and Intervals
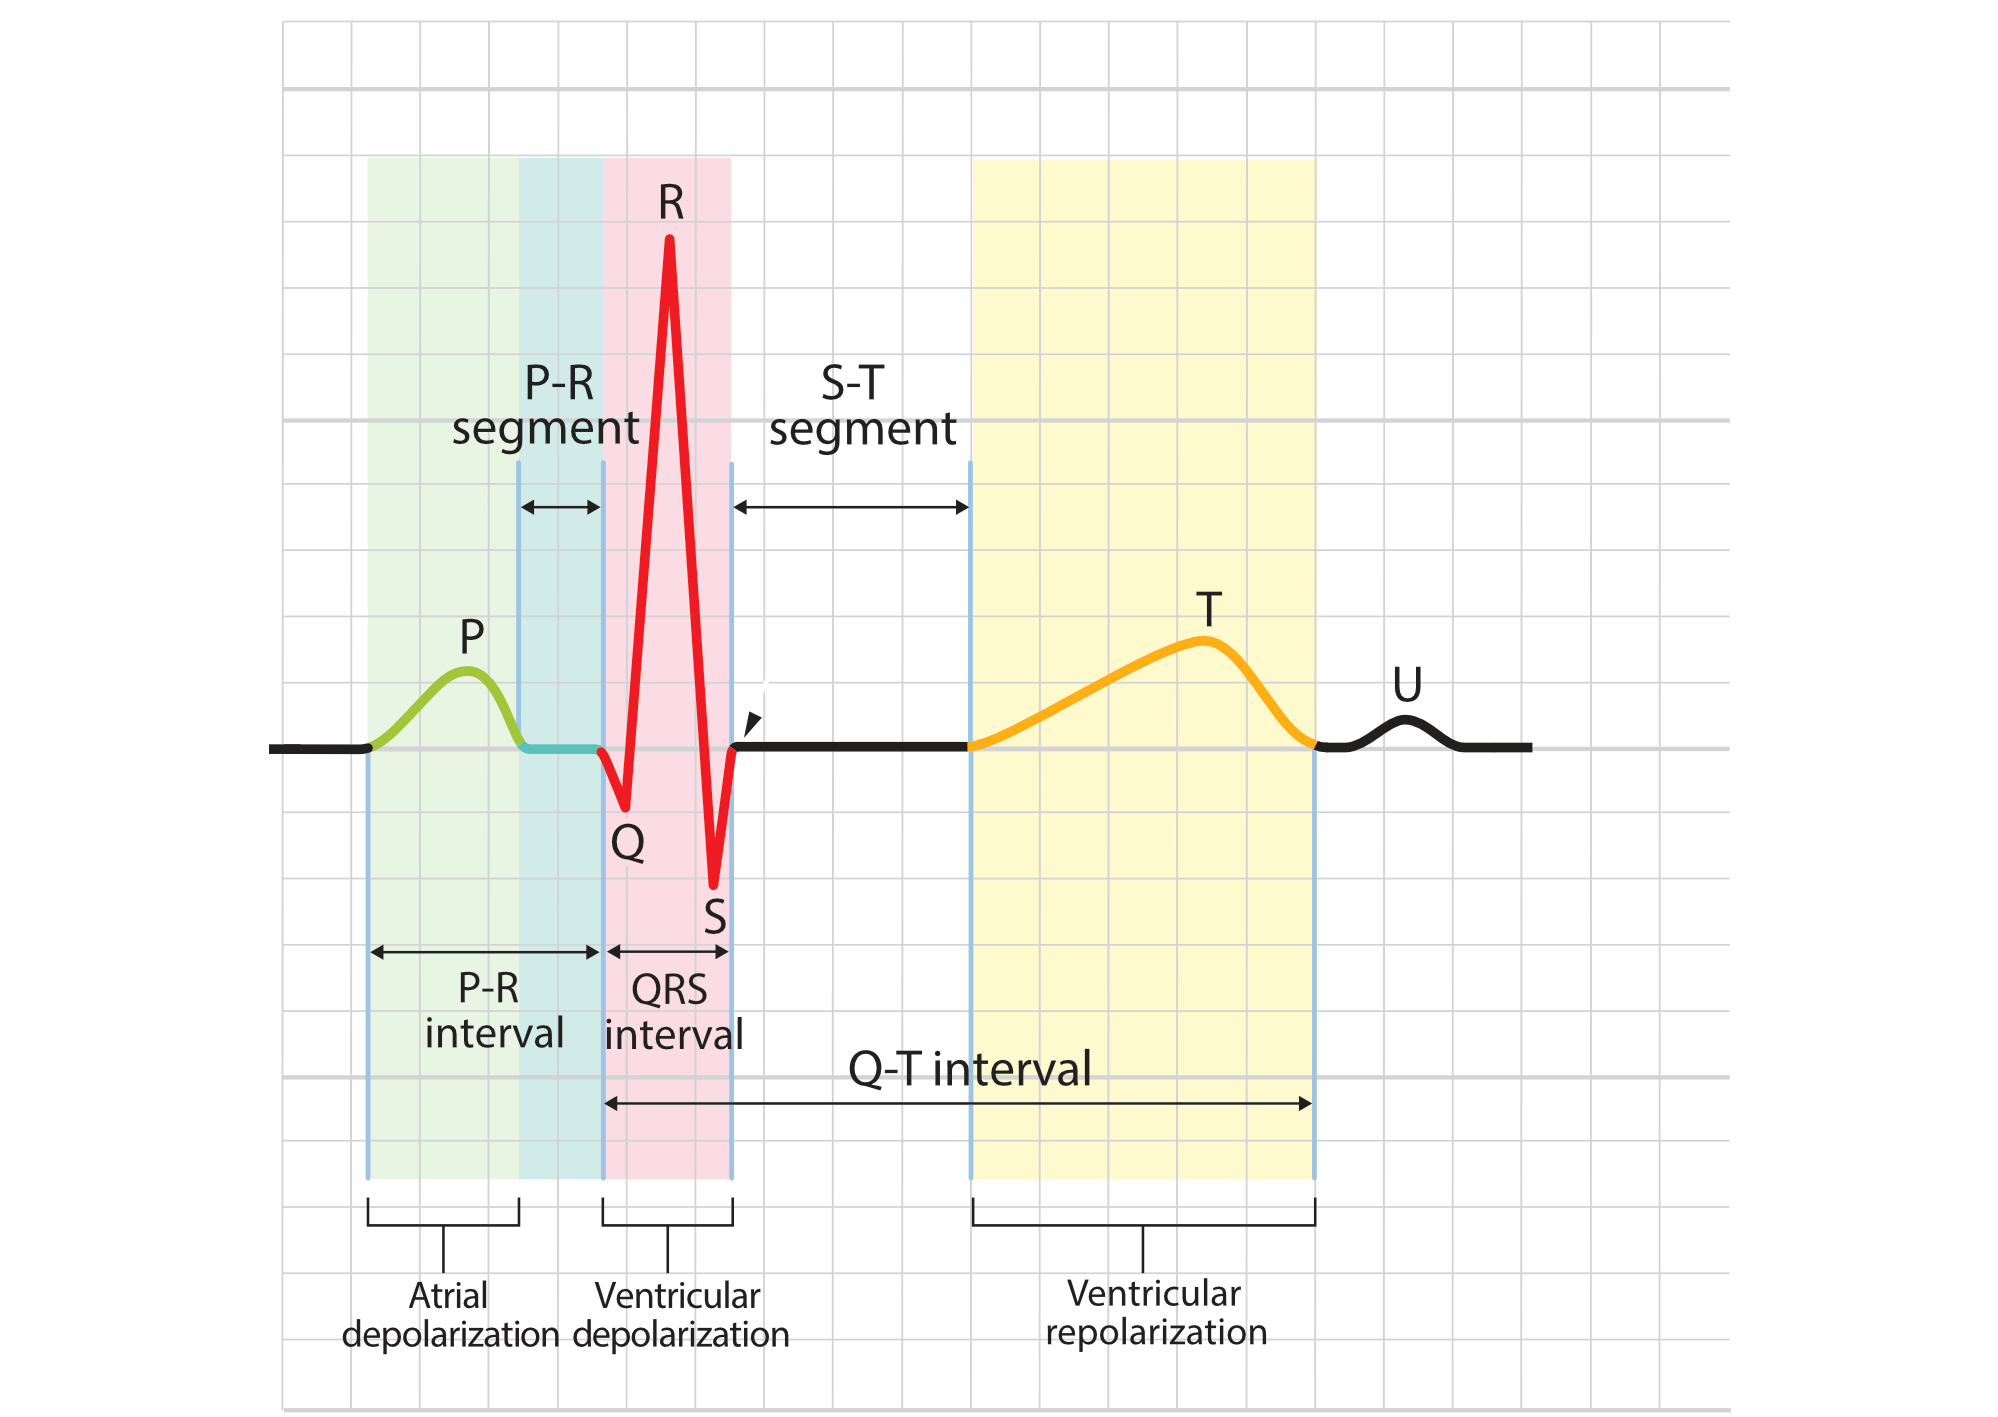
Electrocardiograms are waveforms that represent the electrical activity of each step in the cardiac cycle in various parts of the heart (see Figure 2.5). The various parts of an ECG wave are labeled alphabetically, beginning with the P wave, followed by the QRS complex, and then the ST segment, T wave, and finally the U wave (which, when combined, makes up the ST-T-U complex).
Figure 2.7 ECG Representing Waves, Complexes, and Intervals

ECG Complex
The P wave represents the depolarization of the right and left atria. The P wave has a low-amplitude positive deflection that occurs before the QRS complex. The P wave amplitude is generally < 0.25 millivolts (i.e., < 2.5 small squares), and its duration is < 120 milliseconds (i.e., <3 small squares).
The PR interval is the time recorded from the beginning of the P wave to the end of the PR segment. It represents the time of atrial depolarization and conduction through the AV node and the His-Purkinje system. This interval is dependent on heart rate and is usually between 120–200 milliseconds (i.e., 3–5 small boxes or 0.12–0.20 seconds). It is shorter in patients with faster heart rates because of the enhancement of AV nodal conduction and is longer in bradycardia because of slower AV nodal conduction.
The QRS complex represents ventricular depolarization and normally lasts 60–100 milliseconds (i.e., 1.5–2.5 small boxes). Because of septal depolarization, the initial deflection, or the Q wave, is negative. The next positive deflection is the R wave. The next negative deflection is the S wave.
The ST segment occurs in between the end of ventricular depolarization and the beginning of repolarization. This segment also contains the J point, which is intersected by the end of the QRS complex and the beginning of the ST segment.
The T wave represents the period of ventricular repolarization. Repolarization occurs more slowly than depolarization, so the T wave has a slow and broad positive deflection pattern. Its shape is generally asymmetrical.
The QRS complex and the T wave should have the same direction of deflection and thus are concordant with each other. If an irregular pattern occurs in the T wave (e.g., a notch, bump, ripple, or nipple), it is likely that a P wave has been superimposed on the T wave.
The QT interval is the combined duration of the QRS complex, ST segment, and T wave and thus represents the measurement of ventricular repolarization. The QT interval is dependent on heart rate: it is shorter when the heart rate is faster and vice versa.
The U wave may be seen in precordial leads V2–V4. Its amplitude is typically < 200 millivolts but is more pronounced in bradycardia and hypokalemia. If the QT interval is prolonged, the U wave has likely merged with the T wave.