Electrocardiography – Understanding the ECG Grid
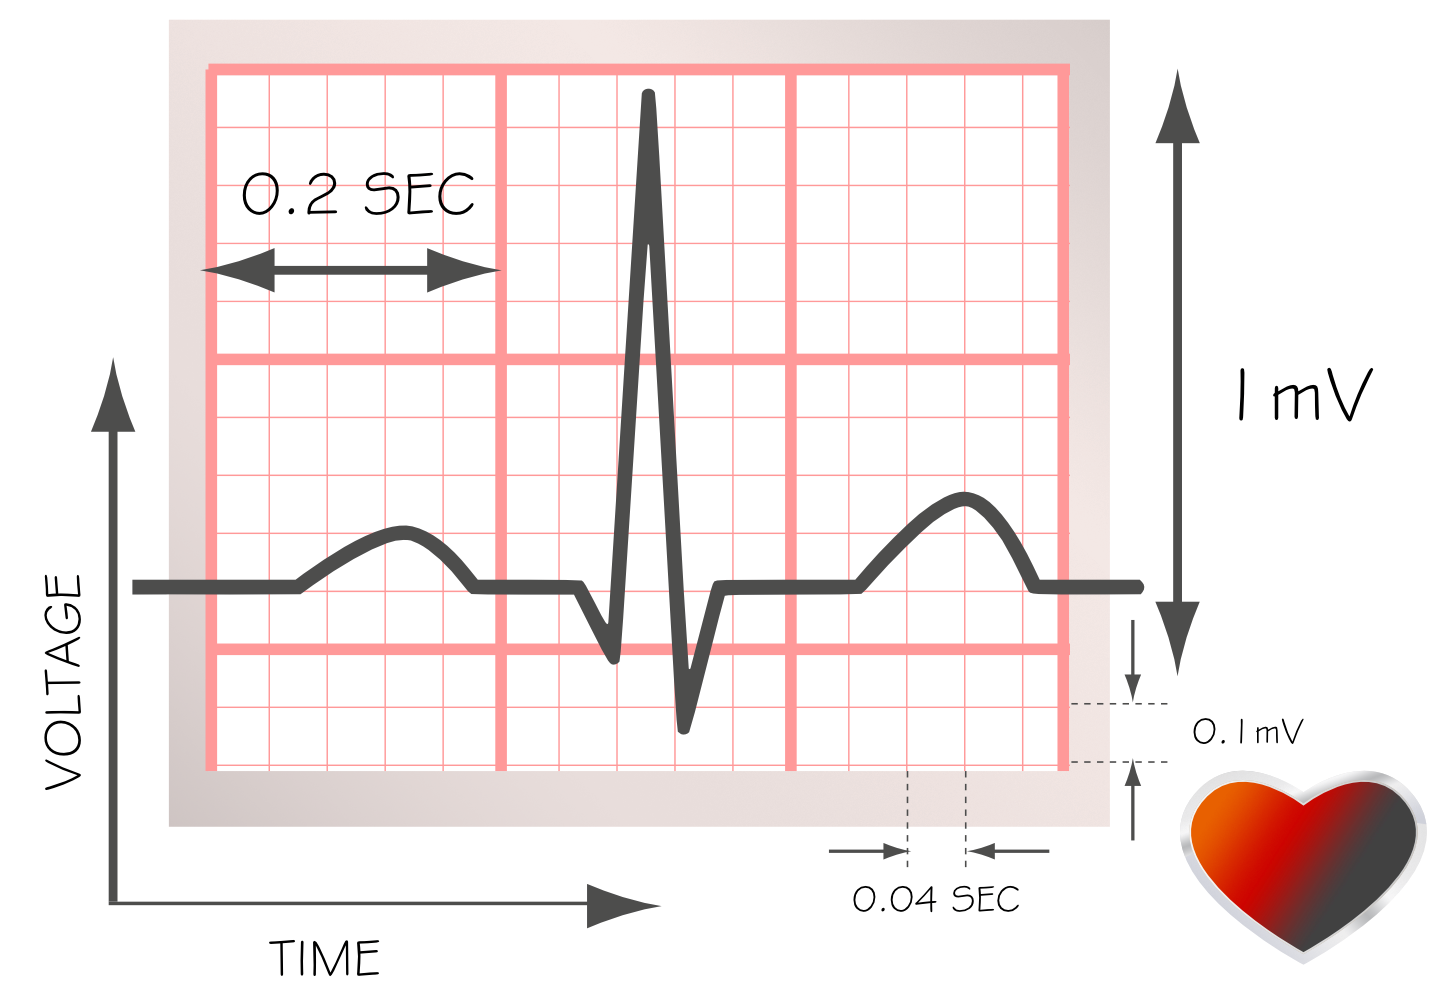
The ECG grid is a piece of paper with squares along the vertical and horizontal axes. The grid is divided into small (1 x 1 mm) squares. Heavier lines mark off larger squares containing a 5 x 5 grid of the smaller squares. Vertically, the small squares represent deflections of electrical activity measured at each event of the cardiac cycle. Horizontally, the small squares represent the time of each recorded electrical cardiac event (see Figure 2.3).
Figure 2.4 The ECG Grid

ECG Grid
The vertical axis records the electrical activity produced by cardiac events. Ten small squares represent 1 millivolt of electricity. However, this voltage scale can be adjusted by the operator depending on the size of the patients’ electrical deflections. Before interpreting the ECG, it is essential to verify where the voltage scale was set when measuring the electrical activity for a particular patient.
The horizontal axis represents the time of the electrical activity. Each small square across the horizontal axis represents 40 milliseconds or 0.04 seconds. Heavier lines that form the large squares comprise five small squares, representing 200 milliseconds, or 0.20 seconds.