ST-Segment Elevation: Definition, ECG Criteria, and Clinical Significance
This guide explains what ECG ST segment elevation is, how to measure it correctly, and why it matters clinically. You will learn how to find the isoelectric baseline, locate the J point, apply the 0.04 second rule, and recognize diagnostic criteria used for STEMI evaluation. We also cover common STEMI mimics that can look like ST segment elevation on an ECG and the importance of reciprocal ST segment depression.
ACLS Certification Association videos have been peer-reviewed for medical accuracy by the ACA medical review board.
Table of Contents
- ST-Segment Elevation
- What is ECG ST Segment Elevation?
- Clinical Physiology: Why Does the ST Segment Elevate?
- How to Measure ST Segment Elevation (Step by Step)
- Diagnostic Criteria for STEMI
- STEMI Mimics: The ELEVATIONS Differential Diagnosis
- The Importance of Reciprocal ST Segment Depression
- Summary
- Frequently Asked Questions About ST Segment Elevation
Article at a Glance
- Criteria for ST-segment elevation from the baseline include:
- Determining the baseline.
- Finding the ST segment.
- Evaluating the J point where QRS ends and the beginning of the ST segment.
- Add 0.04 segment to the J point and determine at that point if the ST segment is above the baseline.
ST-Segment Elevation
This lesson illustrates how to determine ST-segment elevation on an electrocardiogram (ECG). We’ll look at one complex and an ST-segment elevation determination criteria.
Elevation refers to elevation from the baseline. First, determine your baseline, which is the ECG segment where nothing occurs. Look at the least active part of the ECG between a T wave and P wave. It’s known as the TP segment. Find a couple of them, draw a line between them, and mark your baseline.
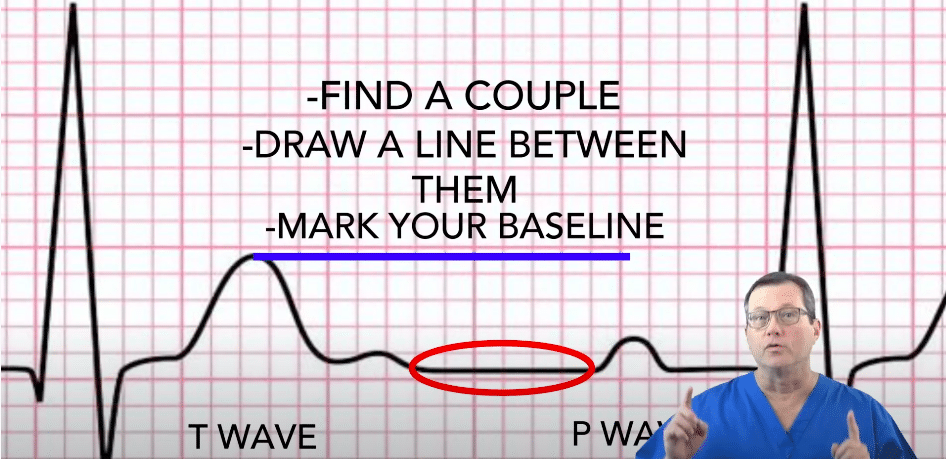
The ST segment goes from the end of the QRS to the beginning of the T wave.
It may be difficult to find the ST segments and deviation source. If so, look at the QRS complex next to it. It may provide a better view. You may also have to scan for other leads contiguous to that lead. After you find it, add one small box equal to 0.04 seconds to the right. That is where you measure the ST Segment elevation down to baseline.
Read: General Stroke Care
What is ECG ST Segment Elevation?
ECG ST-segment elevation is an upward deviation of the ST segment above the isoelectric baseline. The ST segment begins at the end of the QRS complex and ends at the start of the T wave. ST-segment elevation can be a sign of acute myocardial injury, but it can also occur in several non-ischemic conditions. Correct measurement and clinical context are essential before labeling a tracing as STEMI.
Clinical Physiology: Why Does the ST Segment Elevate?
The ST segment represents the period when the ventricular myocardium is uniformly depolarized. When part of the myocardium is injured or ischemic, electrical currents can shift the apparent baseline and create ST deviation. In acute coronary occlusion, transmural ischemia can produce localized ST-segment elevation in contiguous leads. In non-ischemic states like pericarditis or early repolarization, the mechanism is different, and the ST elevation pattern is often more diffuse or has characteristic morphology.
Because multiple conditions can elevate the ST segment, ECG interpretation should include symptom context, serial ECGs, troponin testing when applicable, and comparison with prior tracings whenever available.
How to Measure ST Segment Elevation (Step by Step)
Finding the Isoelectric Baseline (TP Segment)
Start by identifying the isoelectric baseline, which is the ECG segment where there is no electrical activity. The TP segment is commonly used because it lies between the end of the T wave and the beginning of the next P wave. Find at least two TP segments on the same lead, visualize a line between them, and use that as your baseline reference.
Locating the J Point
The J point is where the QRS complex ends and the ST segment begins. This is the key reference point for ST measurement. If the tracing is difficult to interpret, check the neighboring beats in the same lead and look at contiguous leads for confirmation.
The 0.04 Second Rule: Measuring Elevation Correctly
From the J point, move one small box to the right. One small box equals 0.04 seconds. Measure the vertical distance from that point down to the baseline. That value is the ST segment elevation. This method reduces overcalling elevation caused by slurring at the end of the QRS complex and improves consistency across readers.
Tip: If baseline wander or artifact is present, confirm in multiple beats and consider repeating the ECG. Reliable measurement depends on clean signal quality.
Diagnostic Criteria for STEMI
STEMI criteria are based on ST-segment elevation in contiguous leads and must be interpreted with the patient’s symptoms and overall presentation. As a general framework, clinicians look for new ST elevation at the J point in at least two contiguous leads, with thresholds that can vary by lead and patient factors. Because thresholds differ between men and women and can vary in the anterior leads, local protocol and guideline-based criteria should be followed.
- Contiguous leads: elevation should appear in leads that view the same region of the heart
- Clinical correlation: ischemic symptoms and risk profile increase concern
- Serial ECGs: dynamic change supports acute pathology
- Look for reciprocal changes: ST depression in opposing leads can strengthen concern for acute occlusion
STEMI Mimics: The ELEVATIONS Differential Diagnosis
Not all ST-segment elevation is caused by acute coronary occlusion. The patterns below are common STEMI mimics. Use morphology, distribution, clinical context, and reciprocal changes to narrow the differential. Each subsection includes the key ECG clues and what helps separate it from STEMI.
E: Electrolytes (Hyperkalemia)
Hyperkalemia can cause ST-segment changes along with peaked T waves, widening QRS, and progressive conduction abnormalities. ST elevation may appear atypical and is usually accompanied by other potassium-related findings.
L: LBBB (Left Bundle Branch Block)
LBBB alters ventricular depolarization and repolarization, which can produce apparent ST elevation and depression. Evaluation relies on concordance patterns and clinical context rather than simple ST elevation thresholds.
E: Early Repolarization
Early repolarization commonly produces concave ST elevation, often with J point notching or slurring, and is frequently seen in healthy patients. It tends to be stable over time and usually lacks reciprocal depression.
V: Ventricular Hypertrophy (LVH)
LVH can cause secondary ST and T changes called strain patterns. ST elevation in some leads may occur with deep S waves and large voltage criteria.
A: Aneurysm (Left Ventricular Aneurysm)
A left ventricular aneurysm after prior infarction can cause persistent ST elevation that does not resolve. Comparison with prior ECGs and the presence of pathologic Q waves can be helpful.
T: Thoracic Aortic Dissection
Aortic dissection can cause myocardial ischemia if coronary perfusion is compromised. The ECG can show ST elevation, but the clinical picture may include sudden severe pain, pulse deficits, or neurologic symptoms.
I: Inflammation (Pericarditis)
Pericarditis often causes diffuse concave ST elevation across many leads and PR depression. Reciprocal depression is usually absent except sometimes in aVR.
O: Osborn J Waves (Hypothermia)
Hypothermia can produce Osborn waves and ST-segment changes. The ECG may show bradycardia, shivering artifact, and J-point abnormalities.
N: Non ischemic (Brugada, Takotsubo)
Brugada syndrome can show ST elevation patterns in the right precordial leads with characteristic morphology. Takotsubo cardiomyopathy can also cause ST elevation and troponin rise, but follows a different clinical and imaging pattern than STEMI.
S: STEMI (Acute Occlusion)
True STEMI typically shows localized ST elevation in contiguous leads, often with reciprocal ST depression in opposing leads. Symptoms, risk factors, and evolving ECG changes increase concern.
The Importance of Reciprocal ST Segment Depression
Reciprocal ST-segment depression refers to ST depression seen in leads electrically opposite the area of ST elevation. When present, it can increase concern for acute coronary occlusion because it supports the idea of a focal injury pattern rather than a diffuse non-ischemic cause. For example, inferior ST elevation may be accompanied by reciprocal depression in lateral or high lateral leads.
Reciprocal changes are not required for diagnosis, and they can be absent early. However, when clear reciprocal depression is present and the clinical picture fits, it can strengthen the case for urgent evaluation and treatment.
Summary
To determine ST-segment elevation, find the baseline first. Next, find the J point and move 0.04 seconds, or one small box, to the right. Finally, measure from that point to the baseline. That is the ST-segment elevation.
Frequently Asked Questions About ST Segment Elevation
Is ST elevation always a heart attack?
No. ST-segment elevation can occur in acute coronary occlusion, but it can also appear in early repolarization, pericarditis, LVH, LBBB, hypothermia, and other non-ischemic conditions. ECG patterns and symptoms must be interpreted together.
What is the difference between concave and convex ST elevation?
Concave ST elevation is often seen in benign early repolarization and pericarditis, while convex or straight ST elevation can be more concerning for acute occlusion. This is not a perfect rule, so use lead distribution, reciprocal changes, and clinical context.
How much ST elevation is significant?
Significance depends on contiguous leads and guideline criteria that vary by lead location and patient factors. In practice, clinicians apply protocol-based thresholds and consider serial ECG changes and clinical presentation.
Is ST elevation dangerous?
It can be, especially if it reflects acute coronary occlusion that requires urgent care. Some causes are benign, but any new ST elevation with concerning symptoms should be treated as potentially serious until proven otherwise.
Can ST elevation resolve on its own?
Yes, in some cases. Early repolarization is often stable or can vary with heart rate. Pericarditis-related changes can evolve over time. In acute coronary occlusion, ST elevation can change rapidly and may progress, which is why serial ECGs are important.
More Free Resources to Keep You at Your Best
Editorial Note
ACLS Certification Association (ACA) uses only high-quality medical resources and peer-reviewed studies to support the facts within our articles. Explore our editorial process to learn how our content reflects clinical accuracy and the latest best practices in medicine. As an ACA Authorized Training Center, all content is reviewed for medical accuracy by the ACA Medical Review Board.
More to Learn

Master the mean arterial blood pressure (MAP) calculation to assess overall perfusion. Our article helps you understand the significance and accurate measurement of MAP.
Download the Acute Coronary Syndrome Managing STEMI PDF and view the videos to learn the treatment guidelines for managing STEMI.