Introduction to ECG Interpretation
ACLS Certification Association videos have been peer-reviewed for medical accuracy by the ACA medical review board.
Article at a Glance
- It is important for clinicians working in emergency and critical care to have a basic understanding of electrocardiogram (ECG) interpretation.
- Impulses traveling toward a positive electrode will have an upward deflection, while impulses traveling away from a positive electrode will have a negative deflection.
- The ECG grid shows electrical activity of the heart and the time it takes for impulses to travel.
- Lead II is commonly chosen as the monitoring lead.
- ECG waves are labelled alphabetically, beginning with the letter P.
Many healthcare providers taking advanced cardiac life support (ACLS) must know how to interpret ekg results (also known as a 12-lead electrocardiogram or ECG), particularly those who work in emergency and critical care medicine. This foundational skill is covered in our ekg interpretation guide. An electrocardiogram measures electrical signals from the heart.1
Electrodes that detect electrical activity are attached to the skin, and the ECG machine interprets these signals. The output is an ECG tracing that records the time versus amplitude of electrical vector projections and is representative of the heart’s conduction system.
Standard ECG interpretation makes use of 12 leads, as opposed to rhythm recognition, which only requires a 6-second strip obtained from a few leads.

An electrocardiogram measures the electrical activity of the heart.
Electrical Flow and Vector Projection
In the absence of electrical signals flowing toward the positive or negative ends of the electrodes, the ECG machine will record a flat line, also known as an isoelectric line, where the net voltage is 0 millivolts.2
If an impulse is detected that travels toward the positive terminal of the electrode, the ECG machine will record an upward deflection. If an impulse is detected that travels away from the positive terminal of the electrode, the ECG machine will record a downward deflection.

If an impulse travels toward the positive terminal, the electrocardiogram machine will record an upward deflection and vice versa.
Step by Step ECG Interpretation Approach
When learning how to interpret an ecg, a practical way to read a 12-lead ECG is to use the same sequence every time. This reduces missed findings and makes your interpretation easier to communicate.
Step 1 Rate
- Decide if the rhythm is regular or irregular.
- Use the ECG grid to estimate the ventricular rate, then confirm if needed.
Step 2 Rhythm
- Check if a P wave is present before each QRS and if QRS follows each P wave.
- Assess PR interval consistency and look for dropped beats or AV dissociation, while also considering irregular atrial activity such as a premature atrial contraction.
- Confirm if the rhythm is sinus rhythm, atrial, junctional, or ventricular based on the above.
Step 3 Axis
Axis reflects the overall direction of ventricular depolarization in the frontal plane. A fast bedside method uses Lead I and aVF.
- If Lead I is positive and aVF is positive, axis is normal.
- If Lead I is positive and aVF is negative, consider left axis deviation.
- If Lead I is negative and aVF is positive, consider right axis deviation.
- If Lead I is negative and aVF is negative, consider extreme axis.
After rate, rhythm, and axis, you can move on to intervals, QRS morphology, and ST T changes across contiguous leads.
Related Video – Chest Pain EKG Interpretation for ACS
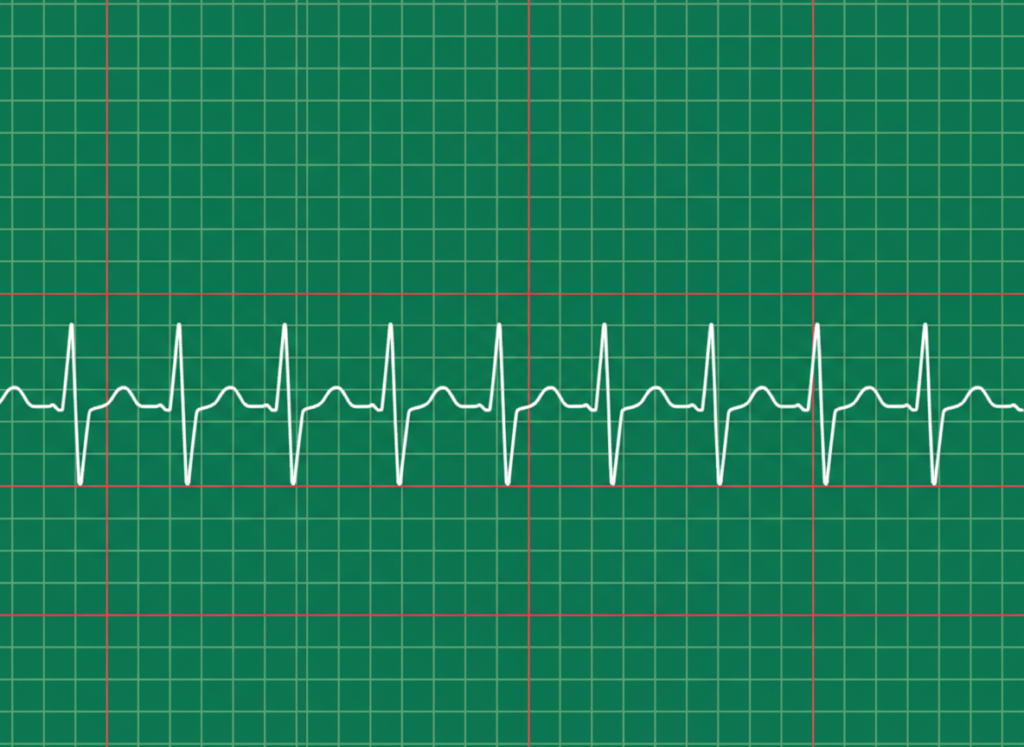
The ECG grid is divided into 1 × 1 mm small squares and demarcated with heavier lines that form large squares consisting of 5 × 5 small squares. Vertically, the squares represent the deflections of electrical activity (volts), while horizontally, the squares represent the time (in seconds) that has elapsed during the recording of the cardiac signal. On the ECG’s default settings, 10 vertical small squares represent 1 millivolt.3 If a patient produces large deflections, the ECG settings can be adjusted so that five small squares can represent 1 millivolt. Therefore, it is important to review the ECG settings before interpreting the results. Each horizontal small square represents 0.04 seconds; therefore, five small squares equal 0.20 seconds. The gridlines on an ECG grid correlate with time. For regular rhythms, estimate the rate using the R to R distance. For irregular rhythms, use a timed method to avoid inaccurate single cycle estimates. Always interpret rate along with symptoms, blood pressure, and perfusion to determine clinical stability. Read: Ventricular Rhythms and AsystoleThe ECG Grid

How to Calculate Heart Rate Using the ECG Grid
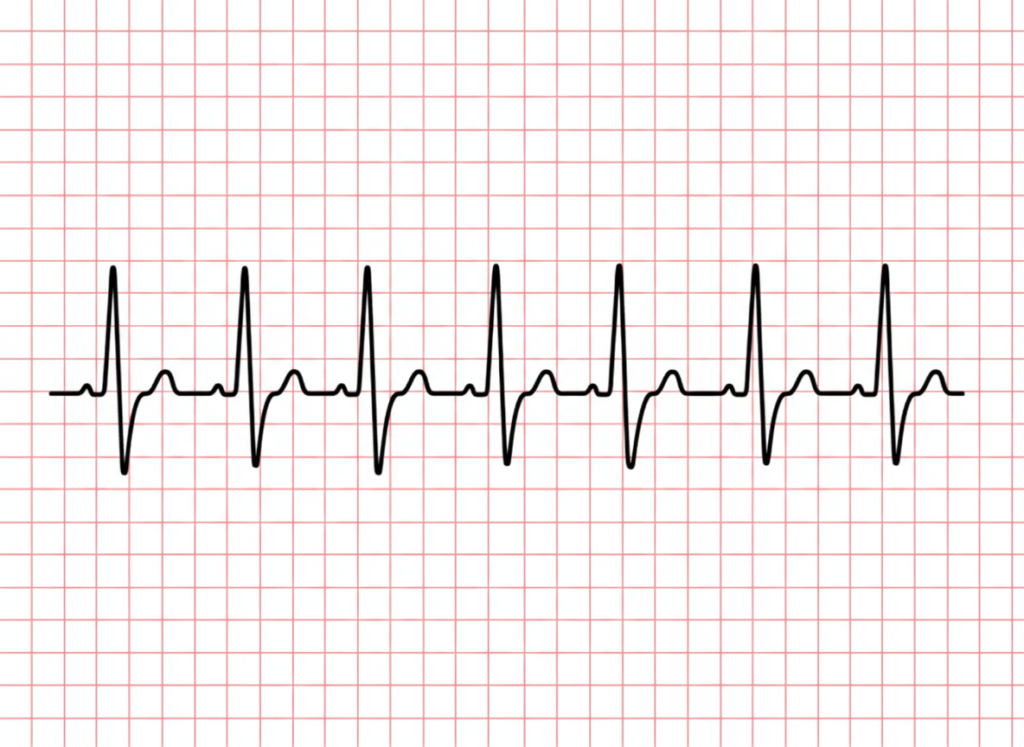
Electrode placement on the patient is important because it provides a consistent point of view of the heart’s electrical pattern, similar to “photographing” the heart’s electrical state at different angles, where each view corresponds to a certain lead. The clinician interprets the pattern in each lead by identifying the waves, complexes, and intervals. Each recorded lead will show a different pattern. This is attributed to the location of each lead where the recorded electrical amplitudes differ from one location to the next. During standard ecg analysis for arrhythmias, a single lead is chosen that represents the heart’s overall electrical pattern. This is known as the monitoring lead. The most common monitoring lead is Lead II, where all the deflections are positive (or should be). Each 12-Lead electrode detects a different vector. A normal sinus rhythm ECG output.The 12 Leads


Related Video – One Quick Question: How Can I Remember Contiguous 12-Lead ECG?
Waves, Complexes, Segments, and Intervals
The ECG waves are labeled alphabetically beginning with the letter P, followed by QRS, then T (and if significant, there may be a U). When the letters are bundled together, this is known as a complex, hence the QRS complex.4

The ECG wave is designated by the letters P through T.
The P Wave
The P wave represents right atrial depolarization followed by left atrial depolarization. This is a low- amplitude positive deflection that occurs before the QRS complex. Its amplitude is generally less than 0.25 millivolts, or less than 2.5 small squares, and its duration is less than 120 milliseconds (0.20 seconds), or less than 3 small squares.
Clinical Significance
- Absent P waves with an irregularly irregular rhythm suggests atrial fibrillation.
- Tall peaked P waves can suggest right atrial enlargement.
- Broad or notched P waves can suggest left atrial enlargement.
- P waves that have no consistent relationship to QRS complexes can suggest AV dissociation.
Normal P wave demonstrating uniform atrial depolarization preceding each QRS complex
Notched P wave pattern suggesting abnormal atrial depolarization
The PR Interval
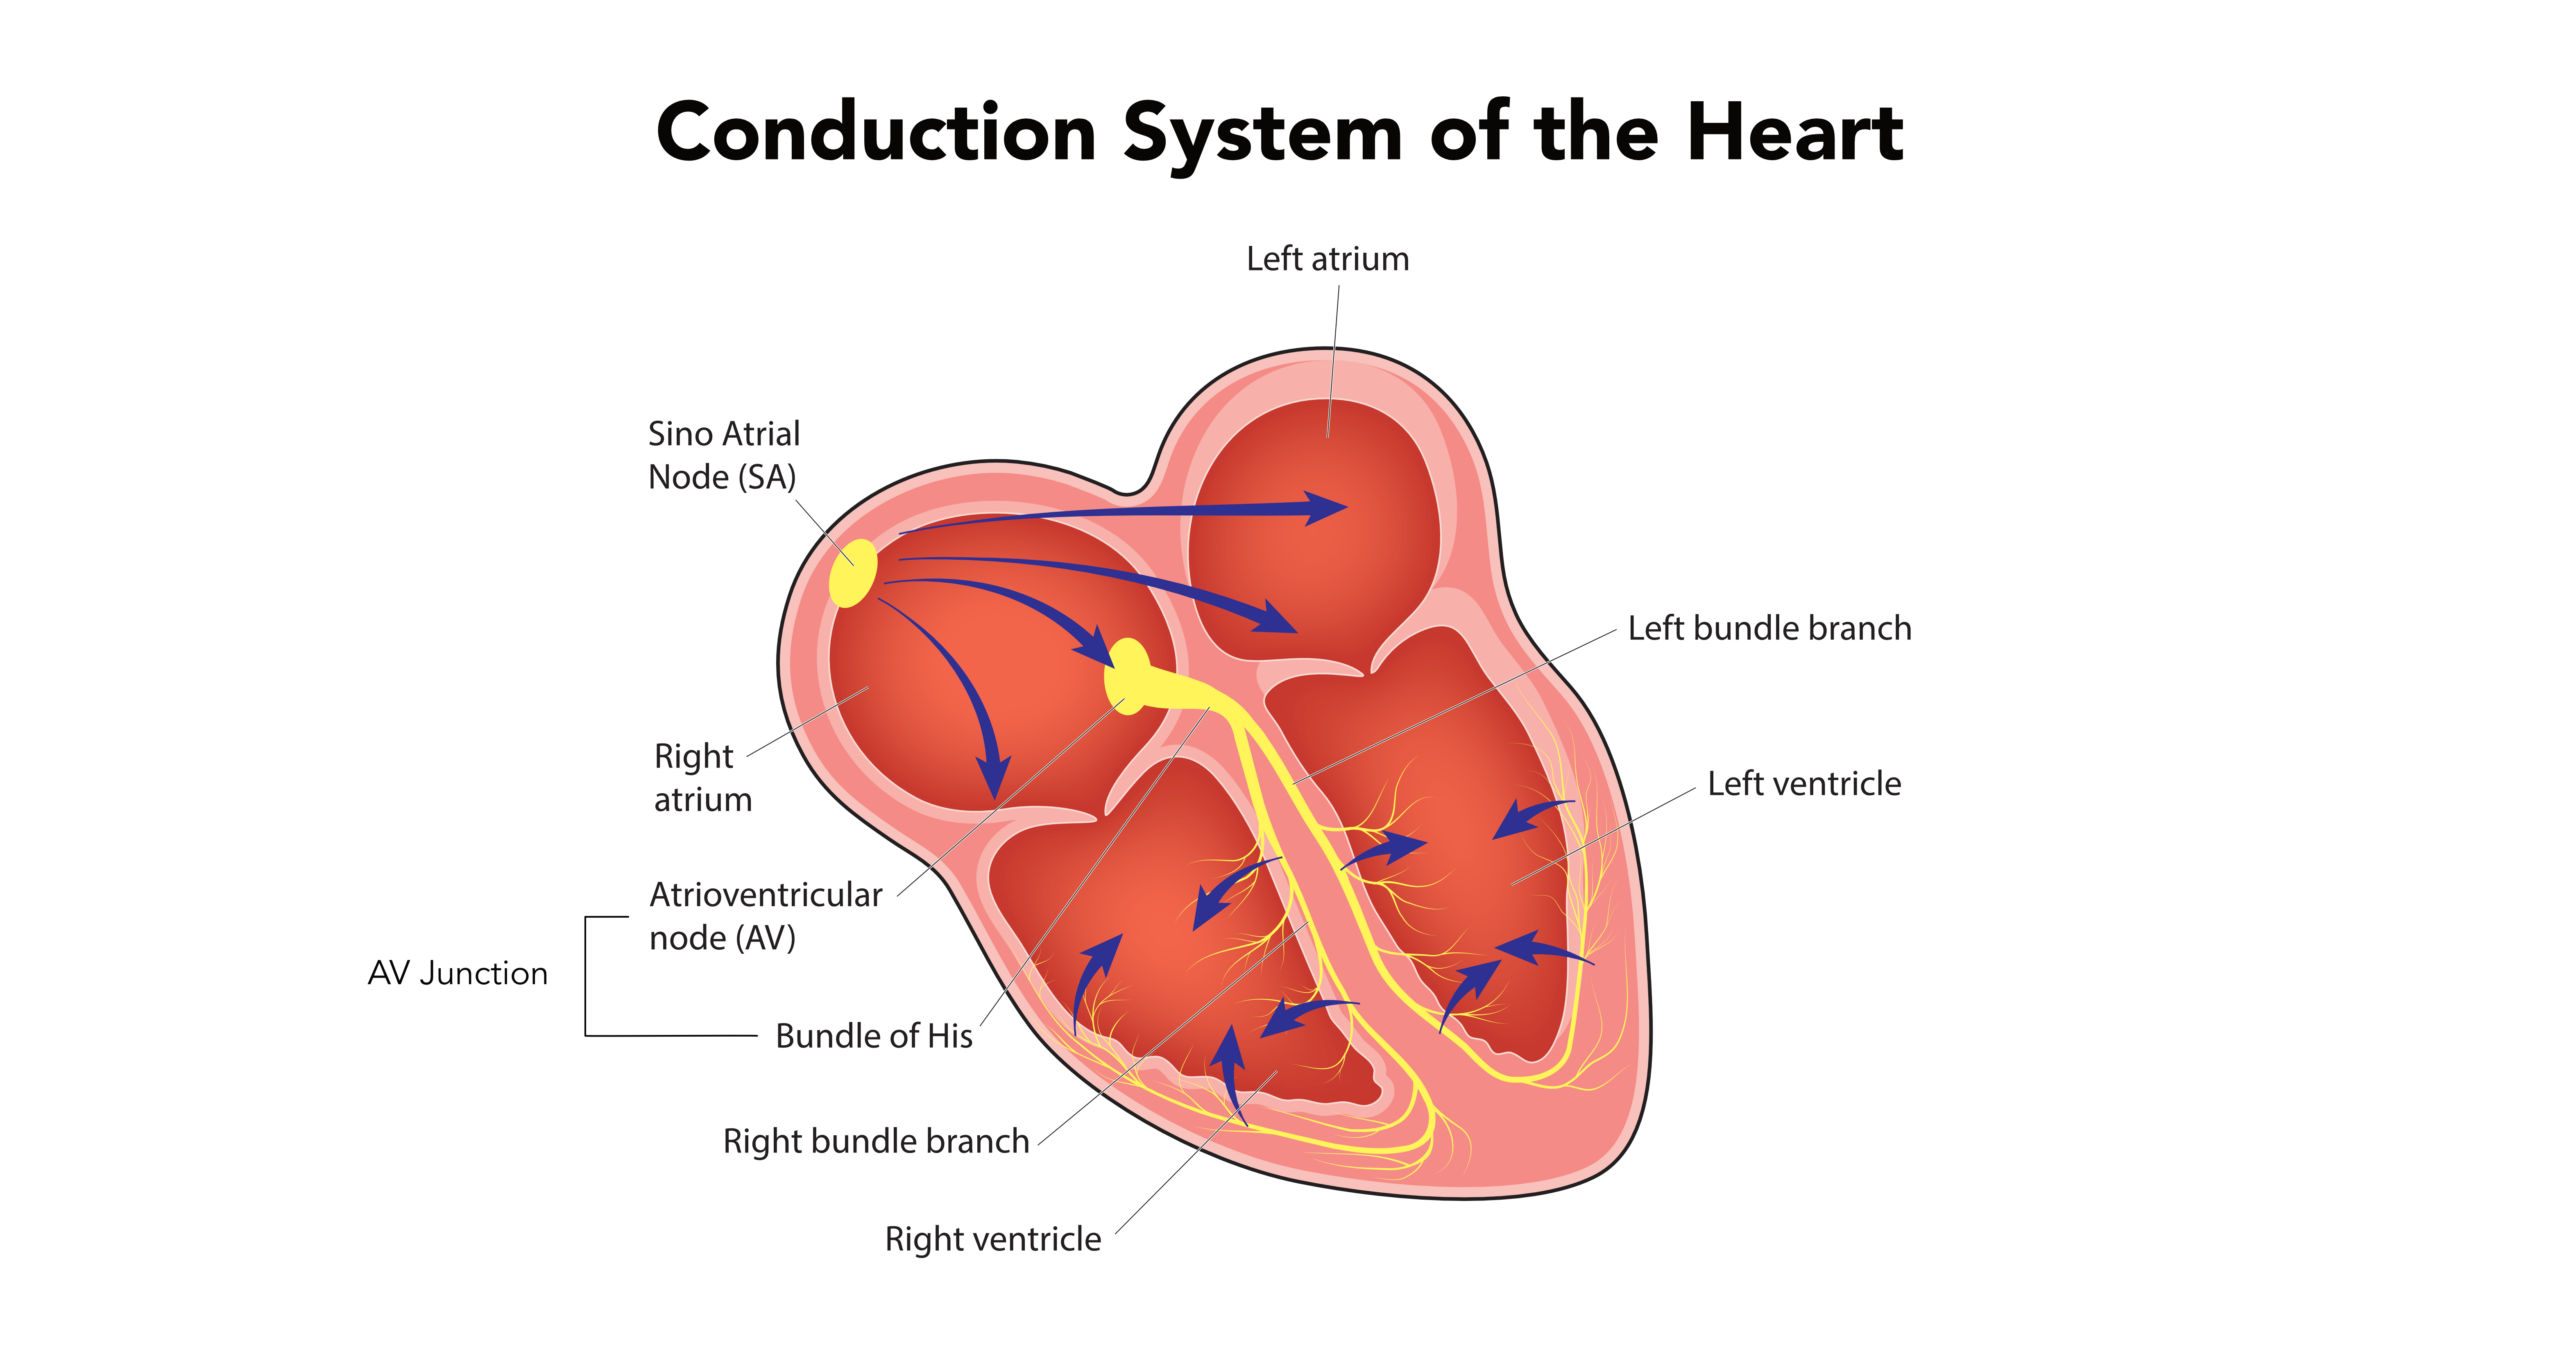
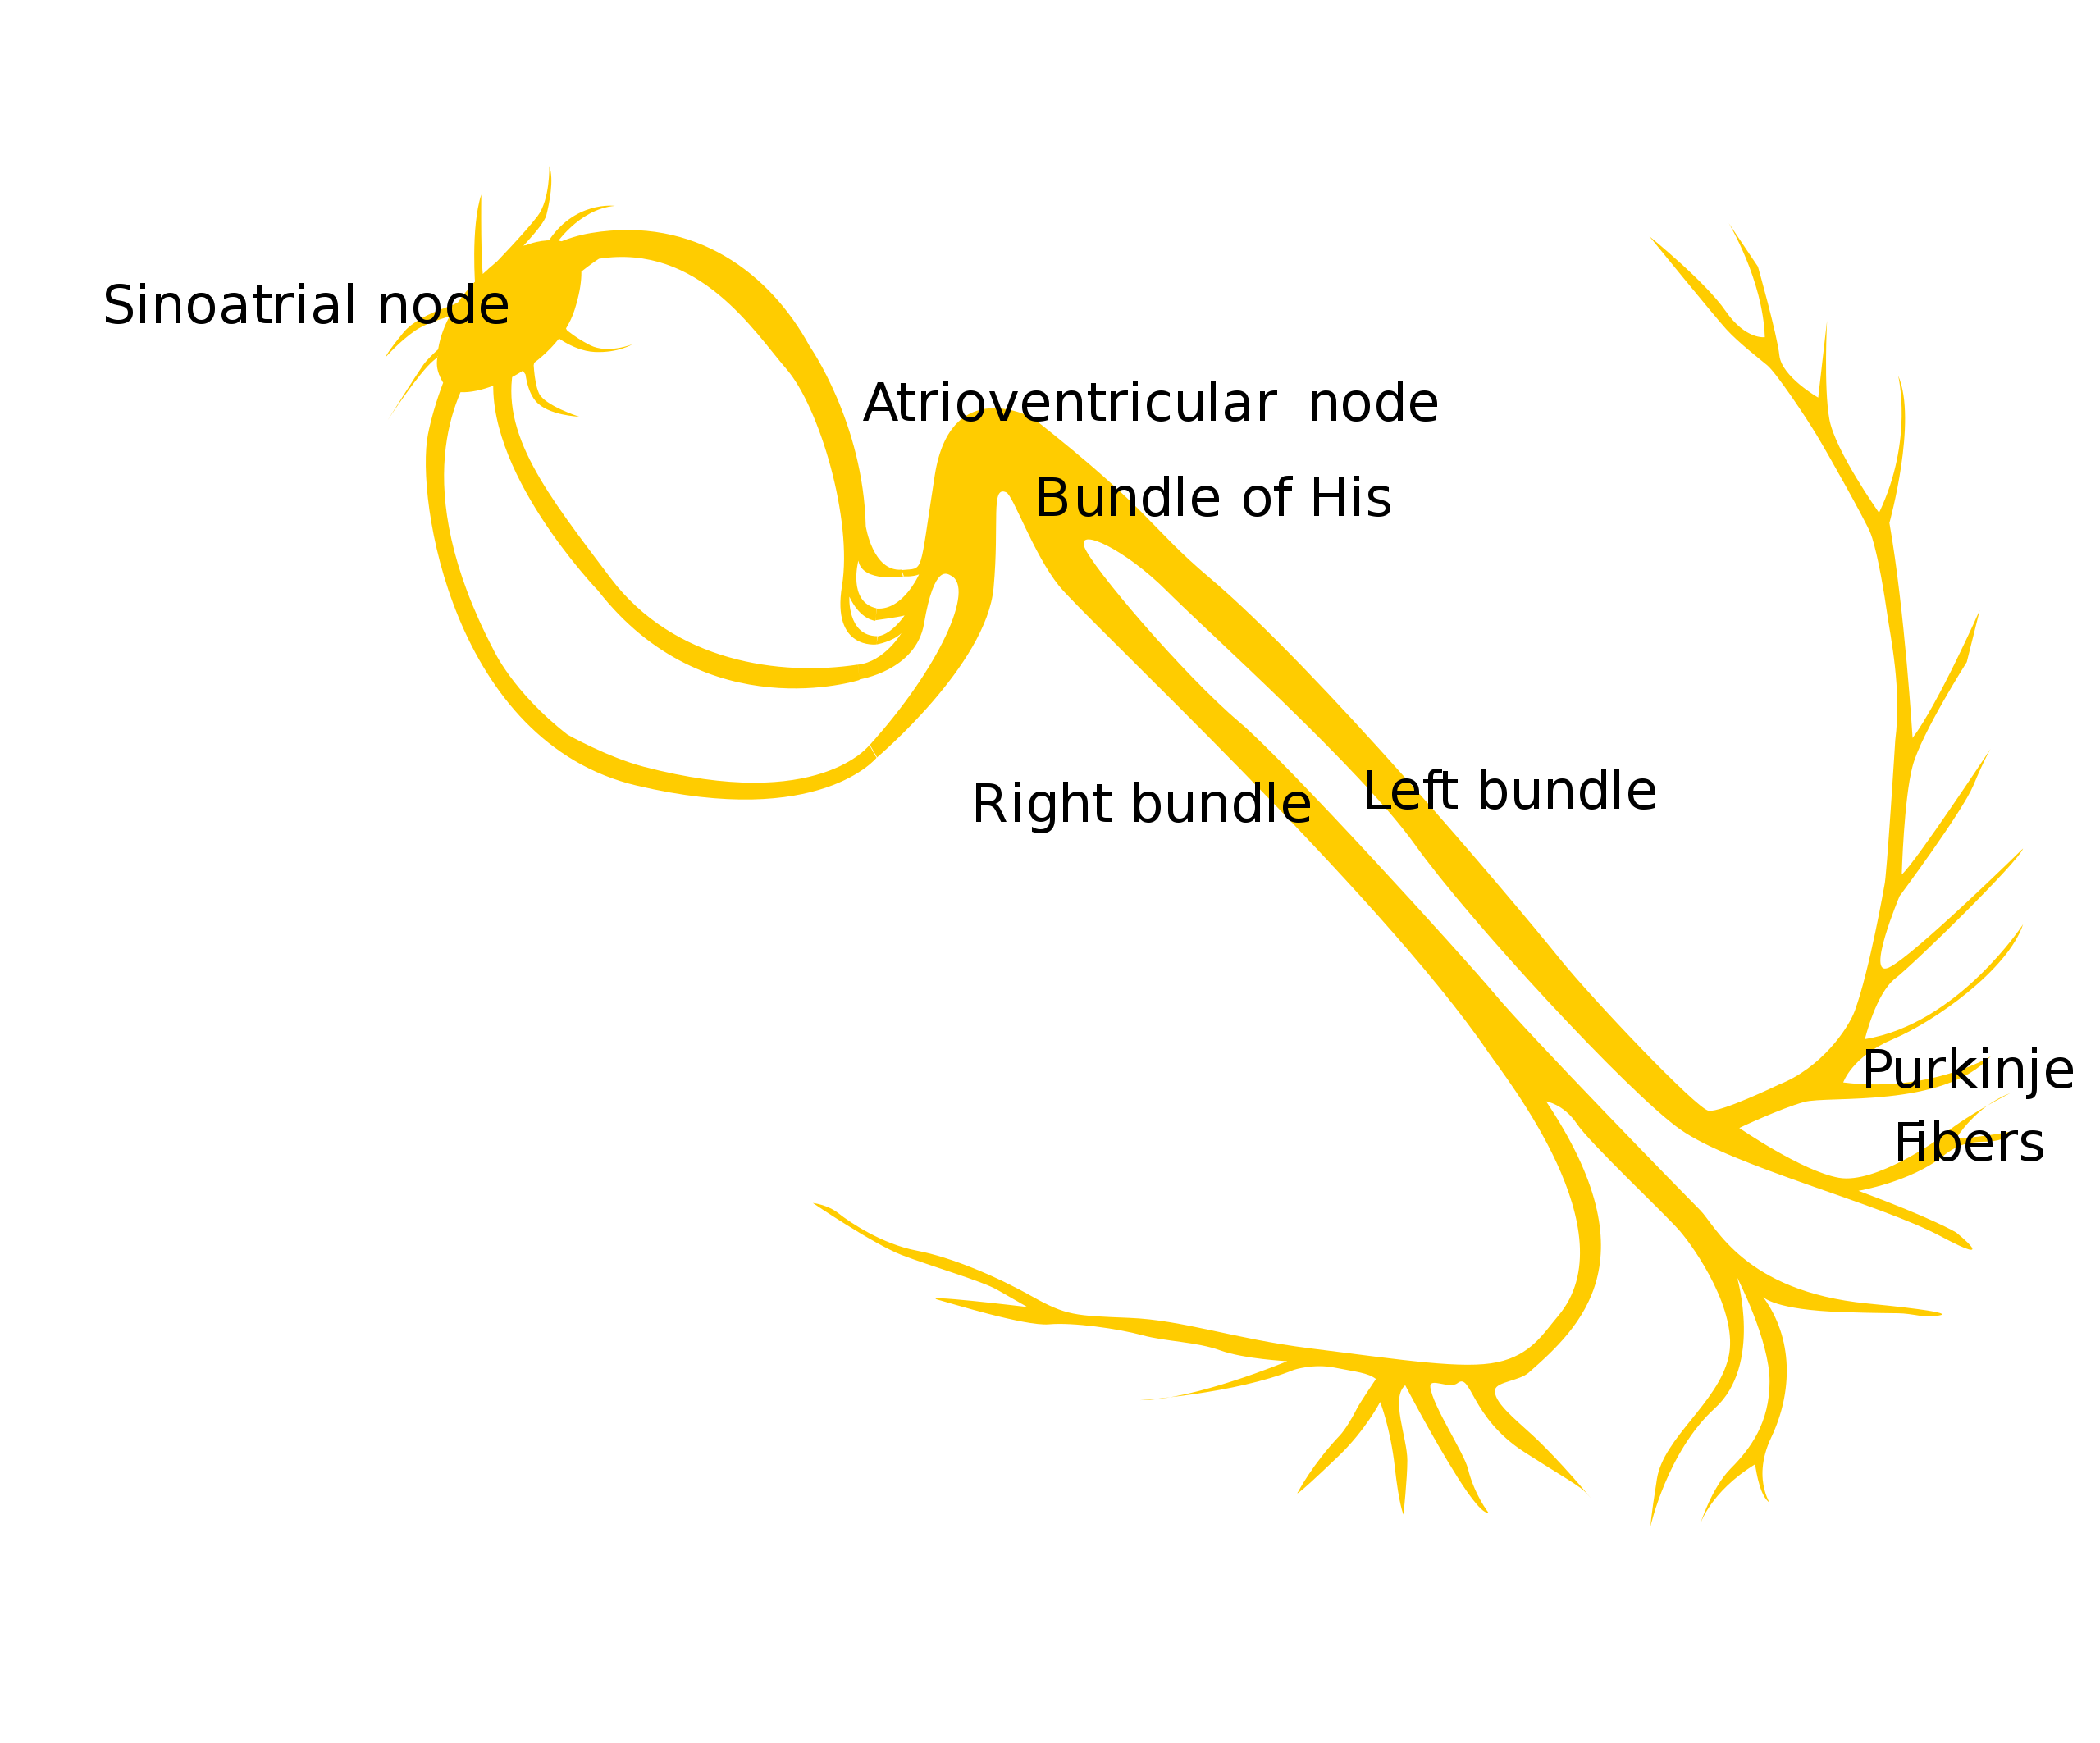
The PR interval is the time recorded from the beginning of the P wave to the PR segment. It represents the time of atrial depolarization and conduction through the atrioventricular (AV) node and the His-Purkinje system.
This interval is dependent on heart rate and is usually between 120–200 milliseconds (0.12–0.20 seconds), or three to five small boxes. It is shorter in faster heart rates due to the enhancement of AV nodal conduction and is prolonged in bradycardia due to slower AV nodal conduction.
Clinical Significance
Changes in the PR interval often reflect conduction delay at the AV node or below it. Heart block patterns are defined by PR behavior and the relationship between P waves and QRS complexes.
First Degree AV Block
- PR interval is prolonged and consistent, greater than 0.20 seconds.
- Every P wave is followed by a QRS complex.
Second Degree AV Block Mobitz Type I
- PR interval progressively lengthens until a QRS complex is dropped.
- The cycle repeats in groups.
Second Degree AV Block Mobitz Type II
- PR interval stays constant on conducted beats.
- Intermittent dropped QRS complexes occur without progressive PR lengthening.
Third Degree AV Block
- No consistent relationship between P waves and QRS complexes.
- Atrial and ventricular rates are independent, indicating complete AV dissociation.
The QRS Complex
The QRS complex represents ventricular depolarization and normally lasts for 60–100 milliseconds (0.06– 0.10 seconds), or 1.5–2.5 small boxes. Its magnitude is not influenced by heart rate.
The initial deflection, the Q wave, is negative due to septal depolarization. The next positive deflection, the R wave, represents depolarization of the ventricular myocardium. The next negative deflection is the S wave, and it represents the end of the depolarization occurring at the high lateral wall.
Clinical Significance
- A widened QRS can suggest branch blocks (such as a right or left bundle branch block), ventricular rhythm, or hyperkalemia.
- Pathologic Q waves can indicate prior myocardial infarction in the appropriate lead groups.
- Low voltage QRS can be seen with obesity, pericardial effusion, COPD, or infiltrative disease.
The ST Segment
The ST segment occurs between the end of ventricular depolarization and the beginning of repolarization. It is also known as the time of electrocardiographic silence because it is usually isoelectric with a slight upward concavity in the normal heart. Clinicians must carefully evaluate this area for ST Segment Elevation, which can indicate acute myocardial infarction. Within this segment is the J point, which is the point that is intersected by the end of the QRS complex and the beginning of the ST segment.
Clinical Significance
ST Elevation
- Can indicate acute myocardial infarction when present in contiguous leads with supportive clinical context.
- Other causes include pericarditis, early repolarization patterns, and ventricular aneurysm.
ST Depression
- Can indicate myocardial ischemia, especially when horizontal or downsloping.
- May also reflect reciprocal changes during acute infarction, digoxin effect, or strain patterns.
When ST changes are seen, interpret them across contiguous leads and correlate with symptoms such as chest pain, diaphoresis, dyspnea, and hemodynamic instability.
The T Wave
The T wave represents the period of ventricular repolarization. The T wave has a slow and broad positive deflection pattern that rapidly returns to the isoelectric line because repolarizations occur slowly as compared with depolarizations; therefore, its shape should be asymmetrical.
The amplitude of the T wave is also variable. The QRS complex and the T wave should have the same direction of deflection; therefore, the QRS complex and the T wave are concordant with each other. If an irregular pattern occurs in the T wave (a notch, a bump, a ripple, or a nipple), then the clinician can consider that the P wave has been superimposed within the T wave.
Clinical Significance
- Inverted T waves can reflect ischemia, ventricular strain, or evolving infarction depending on the lead pattern.
- Tall peaked T waves can be an early sign of hyperkalemia.
- Flattened T waves can be seen with hypokalemia or nonspecific repolarization changes.
The QT Interval
The QT interval is the time recorded that includes the QRS complex, the ST segment, and the T wave. When these time intervals are added up, the QT interval represents ventricular repolarization. The QT interval is dependent on heart rate. It is shorter when the heart rate is faster and vice versa.
Clinical Significance
- Prolonged QT increases risk of polymorphic ventricular tachycardia such as torsades de pointes.
- Causes include medications, electrolyte abnormalities, congenital syndromes, and bradycardia.
- Short QT is less common but can be associated with hypercalcemia or rare genetic conditions.
The U Wave
The U wave may be seen in precordial leads V2 to V4. It is believed to be the repolarization of the His-Purkinje system and the late repolarization of M cells at the mid-myocardial level due to its longer action potential when compared to the endocardium and epicardium.
The U wave is pronounced in bradycardia and hypokalemia. Its amplitude is typically less than 200 millivolts. If the QT interval is prolonged, it is often because the U wave has merged with the T wave.
Clinical Significance
- Prominent U waves can suggest hypokalemia, especially when paired with T wave flattening.
- U waves can become more visible in bradycardia.
Related Video – Systematic Approach to ECG Interpretation
It is important for clinicians to have a basic understanding of ECG interpretation. This article introduces the ECG grid and the various components of the sinus rhythm.
More Free Resources to Keep You at Your Best
Editorial Sources
ACLS Certification Association (ACA) uses only high-quality medical resources and peer-reviewed studies to support the facts within our articles. Explore our editorial process to learn how our content reflects clinical accuracy and the latest best practices in medicine. As an ACA Authorized Training Center, all content is reviewed for medical accuracy by the ACA Medical Review Board.
More to Learn
The junctional rhythms include junctional tachycardia, accelerated junctional, and the junctional escape rhythm.
Atrioventricular blocks, or AV-blocks, are conduction delays that may cause a complete blockage of impulses from the atria to the ventricles. These blocks include First-degree AV-block, 2nd and 3rd Degree AV blocks.