Electrocardiogram Interpretation in 10 Simple Steps
ACLS Certification Association videos have been peer-reviewed for medical accuracy by the ACA medical review board.
Article at a Glance
- On an ECG grid, one small box represents 0.04 seconds while one large box represents 0.20 seconds.
- Electrocardiogram irregularities may indicate conditions such as myocardial infarction and atrial fibrillations.
- Clinicians will learn the 10 steps to interpret an electrocardiogram.
Electrocardiogram Interpretation
Mastering ecg basics involves following 10 easy steps to interpret an electrocardiogram (ECG) rhythm.
- Know the measurements
- Count the heart rate
- Determine rhythm regularity
- Evaluate the P wave
- Measure the PR interval
- Measure the QRS interval
- Look at the ST segment
- Evaluate the T wave
- Measure QT interval
- Interpret the strip

An electrocardiogram records the electronic signals of the heart.
Related Video – Systematic Approach to ECG Interpretation
Know your Measurements
The ECG grid is separated into big and small boxes. Each small box is a measurement of 0.04 seconds, while each big box is 0.20 seconds. Each big box is a 5 x 5 grid of small boxes.
1 small box = 0.04 seconds
1 large box = 0.20 seconds
Cardiac Axis
The cardiac axis describes the general direction of the heart’s electrical depolarization through the ventricles. It is assessed using the standard limb leads, which form the basis of Einthoven’s triangle and provide insight into ventricular conduction patterns and underlying cardiac conditions.
Normal Axis: Between –30° and +90°. This indicates normal ventricular conduction and is commonly seen in healthy adults.
Left Axis Deviation (LAD): Between –30° and –90°. This may be associated with left ventricular hypertrophy, left anterior fascicular block, inferior myocardial infarction, or chronic hypertension.
Right Axis Deviation (RAD): Between +90° and +180°. This can be seen with right ventricular hypertrophy, pulmonary embolism, chronic lung disease, or left posterior fascicular block.
Axis determination is a valuable early step in ECG interpretation, as abnormal axis findings often point clinicians toward structural or conduction abnormalities.
Count the Heart Rate
There are black line markings at the top of the ECG strip. To measure six seconds on the ECG strip, clinicians choose a segment between three of these line markings at the top.
Next, providers count the R-R complexes within the three line markings. That measurement is the number of heartbeats per six seconds.
Lastly, clinicians multiply the number by 10 to get the heart rate per minute.
For example, if there are eight R-R complexes within a six-second strip, the heart rate is 80 beats per minute.
Once the heart rate is calculated, clinicians categorize it based on standard ranges to guide interpretation and clinical decision-making.
- Normal heart rate: 60–100 beats per minute
- Bradycardia: Heart rate less than 60 beats per minute
- Tachycardia: Heart rate greater than 100 beats per minute
These categories help narrow potential rhythm diagnoses and determine whether immediate intervention is required.

The electrical activity of the heart is denoted by the letters P, Q, R, S, T, and U.
Read: Electrolytes Explained
Determine if the Rhythm is Regular
Clinicians use a piece of paper to mark the R-R complexes. They go across the ecg tracing and check if the distance between each R-R complex is the same. If the R-R complexes are evenly spaced, the rhythm is regular.
Alternatively, if someone has atrial fibrillation or dysrhythmia, the R-R complexes will be scattered, indicating irregular rhythm.
Evaluate the P-wave
Clinicians first look for the presence of a P wave before checking to see if there’s one for every complex.
Next, providers check if the P wave exhibits a positive deflection (meaning it is upright) and is normally shaped. If yes, the patient has a sinus rhythm.
P-Wave Memory Aid
Use the mnemonic “ONE P before every QRS” when evaluating P waves:
- O – One P wave for every QRS complex
- N – Normal shape and size
- E – Each P wave upright and consistent
Absent, inverted, multiple, or irregular P waves suggest atrial or junctional rhythms rather than sinus rhythm.
Measure the PR Interval
The PR interval is the time from the onset of the P wave to the start of the QRS complex. The PR interval represents the conduction time through the AV node. A normal PR interval is 120–200 milliseconds.
Clinicians count the number of small boxes between the start of the P wave to the beginning of the QRS complex. The PR interval should be less than 0.20 seconds. Typically, the P wave is between 3–5 small boxes in length. If the PR interval is longer than 0.20 seconds, a first-degree AV block is present.
AV Heart Blocks and PR Interval Findings
First-Degree AV Block: PR interval greater than 0.20 seconds with every P wave conducted. The rhythm is regular, but conduction through the AV node is delayed.
Second-Degree AV Block – Mobitz I (Wenckebach): Progressive lengthening of the PR interval until a QRS complex is dropped. This is usually benign and often transient.
Second-Degree AV Block – Mobitz II: Fixed PR intervals with intermittent dropped QRS complexes. This is more dangerous and may progress to complete heart block.
Third-Degree (Complete) AV Block: No relationship between P waves and QRS complexes. Atrial and ventricular rhythms are completely independent.
Tips for Remembering Types of Heart Block
- “Long but consistent” → First-degree
- “Longer, longer, drop” → Mobitz I
- “Same PR, sudden drop” → Mobitz II
- “No relationship” → Third-degree
Measure the QRS Interval
Physicians start counting where the Q leaves the baseline and stops when the S wave returns to baseline. A normal QRS interval is between 0.08 and 0.10 seconds. An interval between 0.10 and 0.12 seconds is slightly prolonged.
Any QRS complex longer than 0.12 seconds (three small boxes) indicates a bundle branch block, an electrical conduction problem through the bundle branches. It does not mean a physical block is present.
The width of the QRS complex reflects how efficiently electrical impulses travel through the ventricles.
Narrow QRS Complex (≤ 0.12 seconds): Indicates normal ventricular conduction originating above the ventricles, such as sinus rhythm or atrial rhythms.
Wide QRS Complex (> 0.12 seconds): Suggests abnormal ventricular conduction. Common causes include bundle branch blocks, ventricular rhythms, pre-excitation syndromes, or electrolyte abnormalities, or associated findings such as ST Segment Elevation.
Morphology changes, such as notched or slurred QRS complexes, can further suggest left or right bundle branch block patterns. Recognizing QRS width and shape helps clinicians differentiate supraventricular from ventricular rhythms.
Look at the ST Segment
The ST segment is in between the end of the S wave to the beginning of the T wave. If the ST segment is depressed or elevated, it indicates ischemia or infarction.
Evaluate the T wave
Similar to the P wave, providers ensure there is an upright T wave for every complex. An inverted T wave indicates some degree of ischemia.
Measure the QT Interval
The QT interval is the start of the Q wave to the end of the T wave, representing the time it takes for the ventricles to depolarize and repolarize. The QT interval should not be longer than 0.50 seconds (500 milliseconds).
If a patient has a prolonged QT interval, they may be susceptible to fatal dysrhythmias. Some medications prolong the QT interval, such as clarithromycin and ketoconazole.
Interpret the ECG Strip
Finally, clinicians evaluate the overall ECG strip.

The ECG strip at the top shows bradycardia, while the one at the bottom displays tachycardia.
Summary
The ECG grid contains large and small boxes. Large boxes represent 0.20 seconds, while the small boxes represent 0.04 seconds.
Clinicians perform 10 steps to interpret an ECG rhythm. They must know measurements, count the heart rate, determine rhythm regularity, evaluate the P wave, measure the PR interval, measure the QRS interval, observe the ST segment, evaluate the T wave, and interpret the ECG strip.
More Free Resources to Keep You at Your Best
Editorial Note
ACLS Certification Association (ACA) uses only high-quality medical resources and peer-reviewed studies to support the facts within our articles. Explore our editorial process to learn how our content reflects clinical accuracy and the latest best practices in medicine. As an ACA Authorized Training Center, all content is reviewed for medical accuracy by the ACA Medical Review Board.
More to Learn
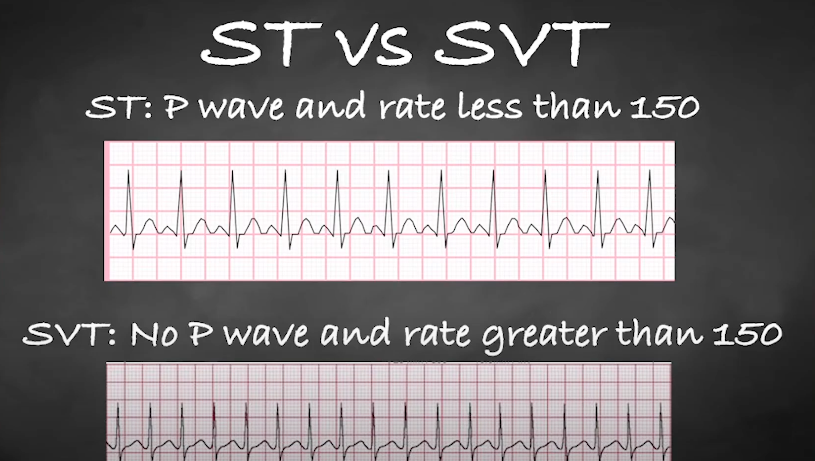
Understand the differences between ST and SVT during an electrocardiogram (ECG) interpretation by reading our comprehensive article.
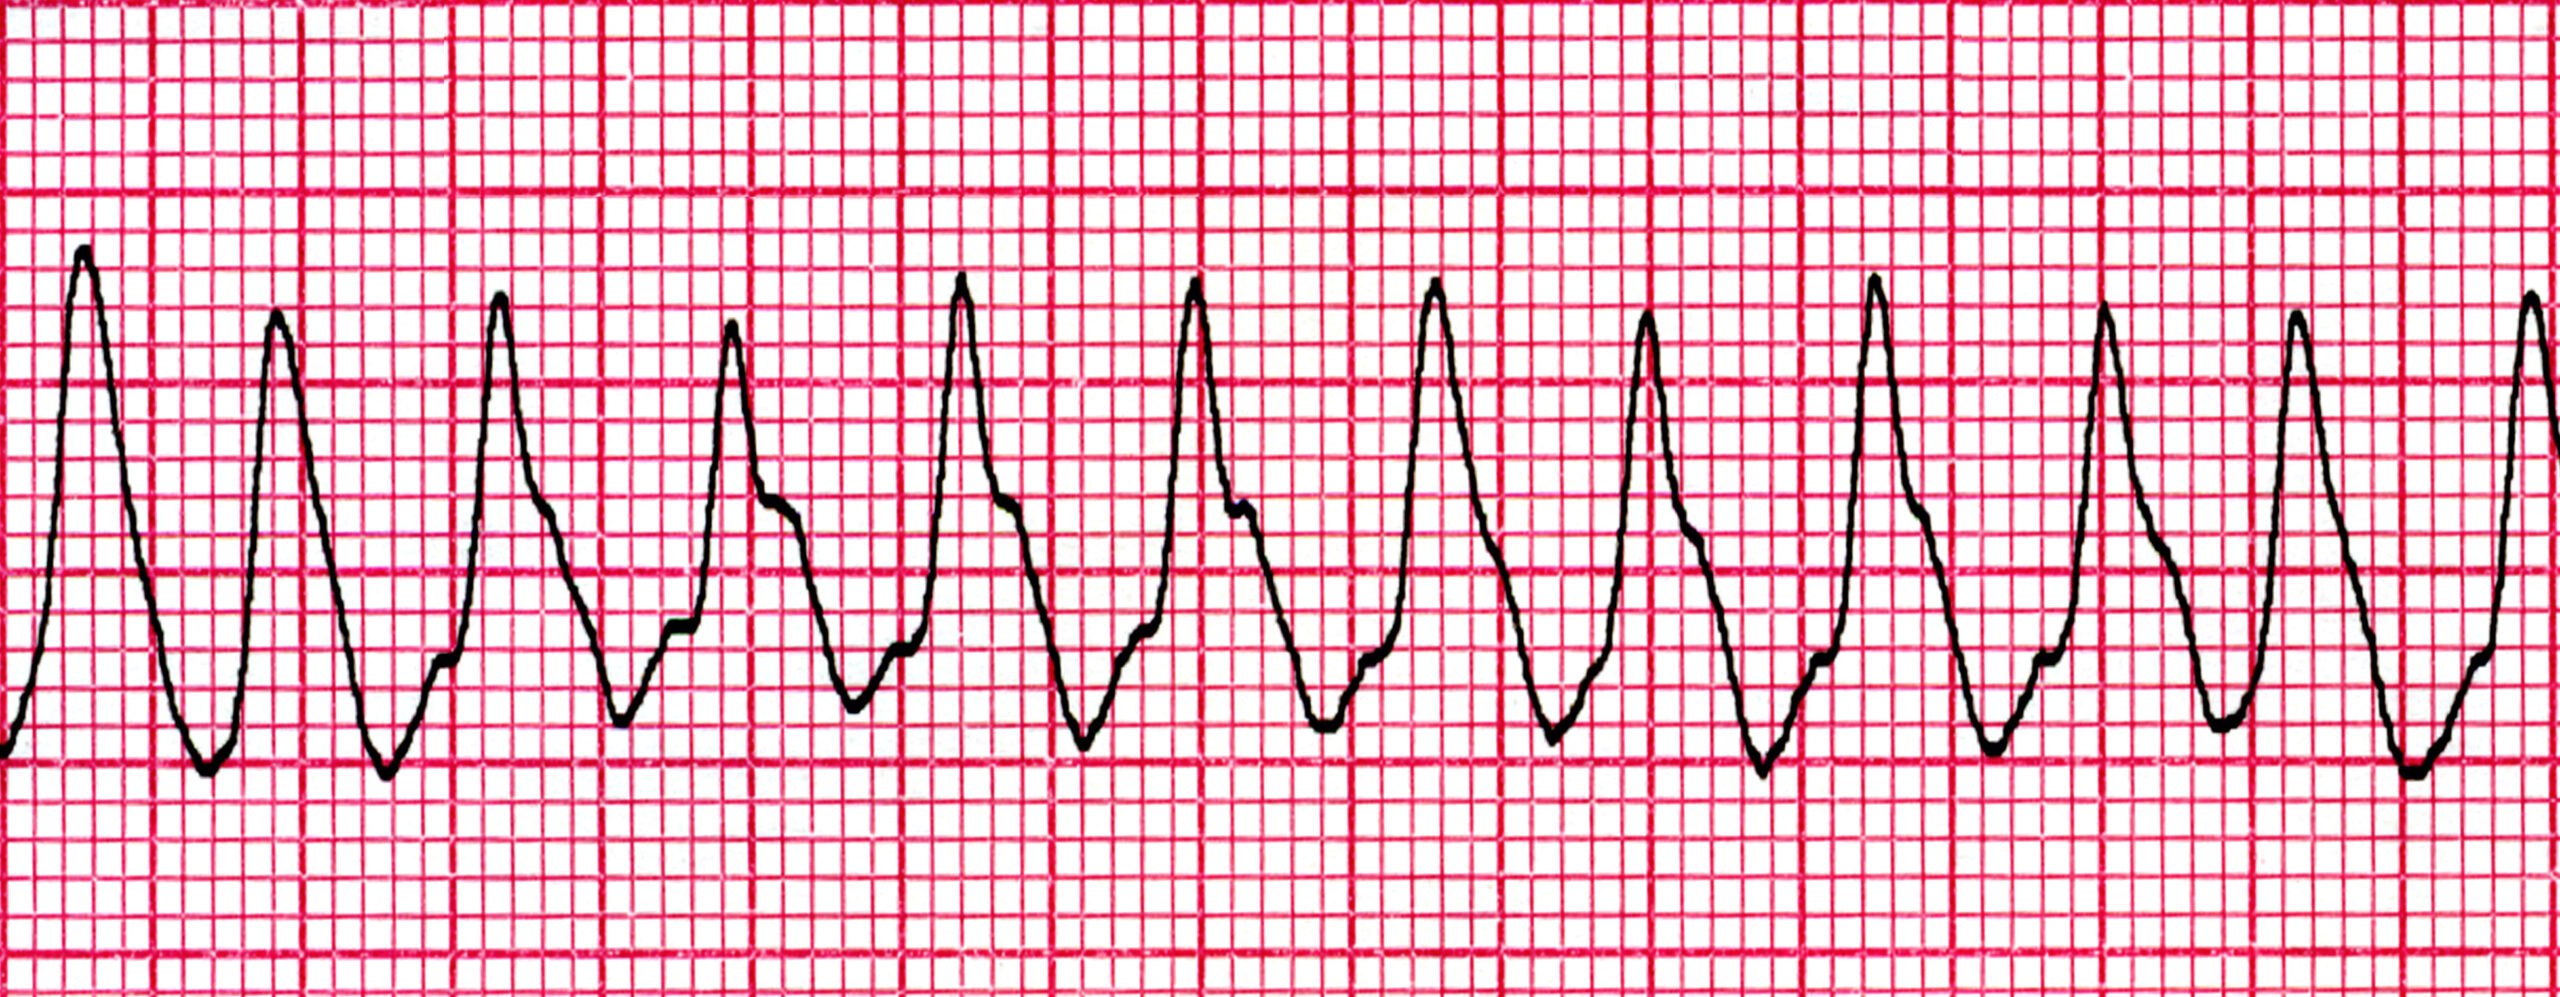
In Ventricular Rhythms, the QRS-complex represents ventricular depolarization. Impulses generated from the ventricles have prolonged QRS-complexes. In this section, learn about ventricular rhythms and asystole.