Einthoven’s Triangle Explained: ECG Leads I, II & III
Einthoven’s triangle is a foundational concept in electrocardiography (ECG). It is an imaginary inverted triangle formed by three specific electrodes placed on the body (Right Arm, Left Arm, Left Leg) that helps clinicians understand the direction of electrical currents in the heart. This article explains the fundamentals of ECG Leads I, II, and III, standard polarity rules, Einthoven’s Law, and how these principles apply to analyzing specific cardiac rhythms.
ACLS Certification Association videos have been peer-reviewed for medical accuracy by the ACA medical review board.
Article at a Glance
- The Three Electrodes: Learn to identify the Right Arm (RA), Left Arm (LA), and Left Leg (LL) placements used to create the triangle.
- Standard Limb Leads (I, II, III): Understand how these bipolar leads measure potential differences between electrode pairs.
- Polarity & Deflection Rules: Grasp why electrical vectors traveling toward a positive electrode create upward deflections on an ECG.
- Einthoven’s Law: Discover the mathematical relationship where Lead I + Lead III = Lead II.
- Clinical Application: See how this foundational knowledge explains why Lead II is the standard monitoring rhythm and why PJCs (premature junctional contraction) create inverted P-waves.
Einthoven’s Triangle
Whether you’re working through ACLS certification online or brushing up in a classroom setting, understanding conduction through the heart and how these tracings occur on our ECG paper is essential. Let’s talk about Einthoven’s P wave and examine Einthoven’s triangle first.
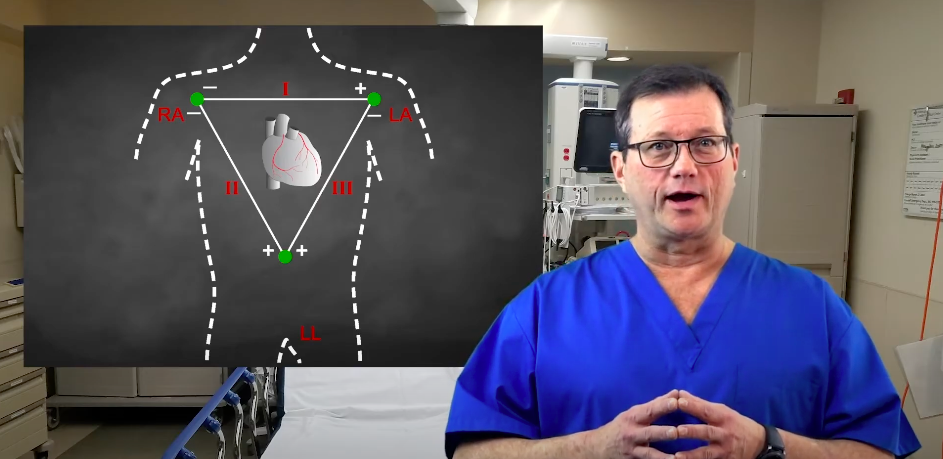
Einthoven’s triangle is an imaginary formation of three limb leads in the shape of a triangle.
Einthoven’s triangle relies on three core electrodes placed on the body: the Right Arm (RA), Left Arm (LA), and Left Leg (LL). The standard limb leads (Lead I, Lead II, and lead iii) are “bipolar,” meaning they measure the electrical potential difference between two specific electrodes, one acting as the negative pole and the other as the positive pole.
| Lead | Negative Electrode (-) | Positive Electrode (+) | Axis Angle |
|---|---|---|---|
| Lead I | Right Arm (RA) | Left Arm (LA) | 0° |
| Lead II | Right Arm (RA) | Left Leg (LL) | +60° |
| Lead III | Left Arm (LA) | Left Leg (LL) | +120° |
Polarity and Deflection Rules: The fundamental rule of ECG interpretation is based on vector direction. Whenever the heart’s electrical conduction moves towards a positive electrode, it creates an upward (positive) deflection on the ECG tracing. Conversely, if the impulse moves away from the positive electrode, it produces a downward (negative) deflection. If the electrical vector travels exactly perpendicular (90 degrees) to the lead’s axis, the resulting complex will be biphasic (both up and down) or isoelectric (flat).
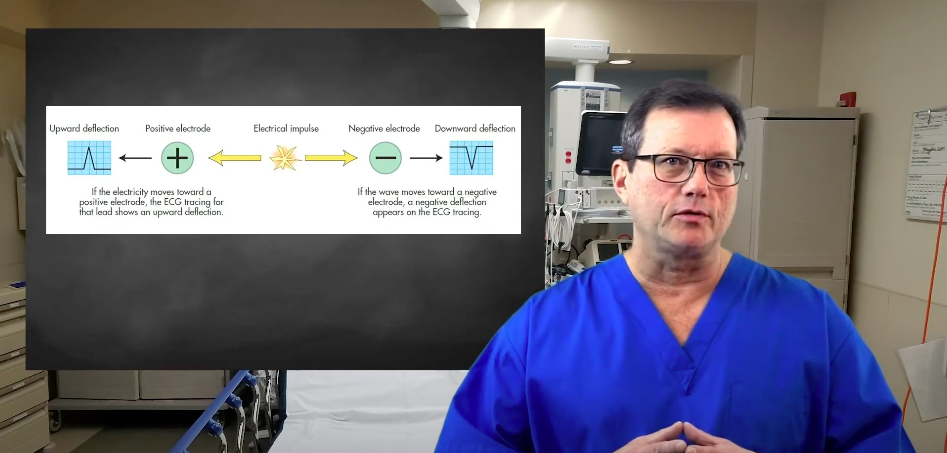
When the electrical conduction of the heart moves towards a positive electrode, the ECG tracing will show an upward deflection.
Einthoven’s Law: Lead I + Lead III = Lead II
Einthoven’s Law is a mathematical principle stating that the electrical potential of Lead II is equal to the sum of the potentials of Lead I and Lead III at any given moment during the cardiac cycle. For example, if the QRS amplitude in Lead I is +4 mm and in Lead III is +6 mm, the QRS amplitude in Lead II will be +10 mm. This rule helps clinicians mathematically verify the accuracy of electrode placement.
Why is Lead II commonly used?
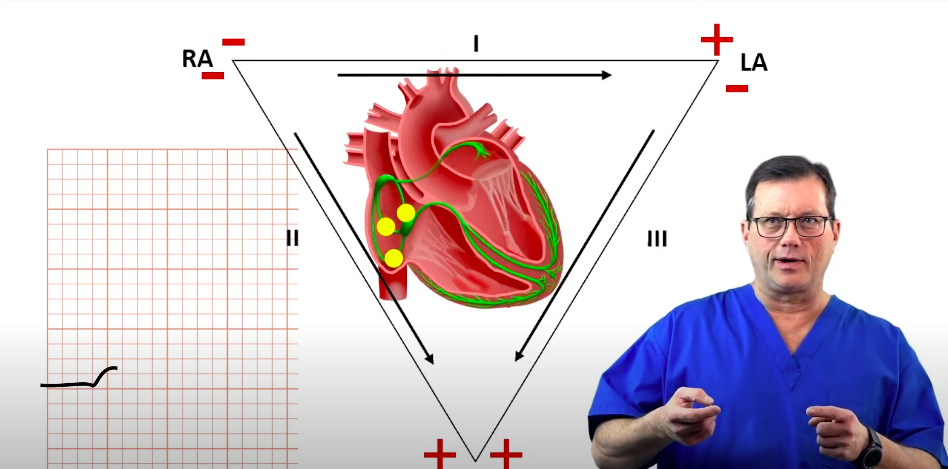
You will frequently see Lead II used as the standard monitoring rhythm strip. The electrical axis of Lead II sits at +60°, pointing from the Right Arm (negative) to the Left Leg (positive). Because the heart’s normal electrical impulse originates in the SA node (upper right) and travels down and to the left toward the ventricles, this normal conduction pathway aligns almost perfectly with the Lead II axis. Therefore, Lead II typically provides the tallest, clearest, and most upright P waves and QRS complexes.
Let’s look at how this specific lead axis perfectly illustrates normal P wave morphology. During a normal sinus rhythm, conduction starts at the SA node and moves directly toward the positive electrode of Lead II (the left leg). On the ECG, we see this as a positive, upward-deflecting P wave. The P wave terminates once the conduction reaches the AV node. This visually represents the impulse traveling perfectly along the Lead II pathway.
Read: Interpreting an ECG Strip
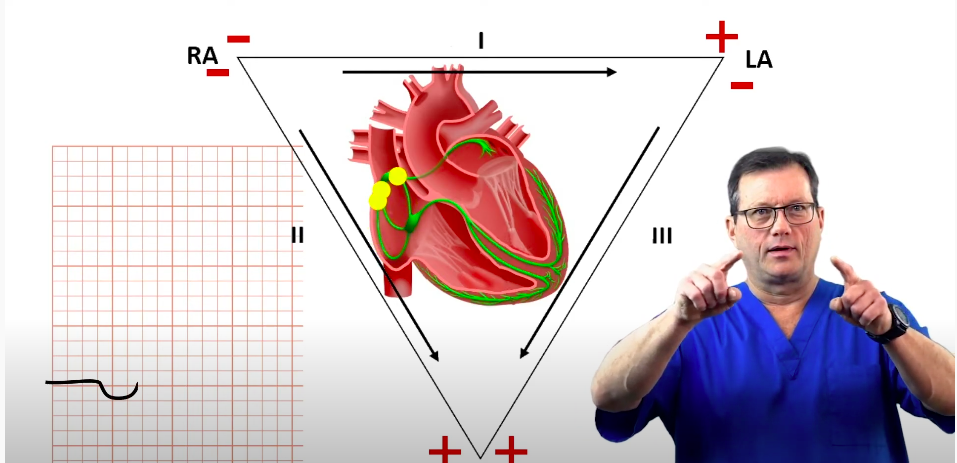
The conduction moves from the SA node to the AV node during the P wave.
Premature Junctional Complex (PJC)
By applying the rules of Einthoven’s triangle, we can easily understand abnormal rhythms. Let’s consider a premature junctional complex (PJC). In a PJC, the electrical conduction originates at the AV junction rather than the SA node. Because the AV node is located physically below the atria, the electrical impulse must travel upwards (retrograde) to depolarize the atria.
Looking specifically at the Lead II axis (+60°), this retrograde conduction is moving away from the positive Left Leg electrode and toward the negative Right Arm electrode. According to our deflection rules, energy moving away from the positive pole creates a downward deflection. That is precisely what creates the inverted P wave seen during a PJC in Lead II.
For a quick overview of how these specific ectopic beats function and disrupt the normal cardiac cycle, watch this brief lesson on what PJCs are and how to identify them.
A PJC shows an inverted P wave on the ECG tracing due to retrograde atrial activation moving away from the positive pole of Lead II.
Now, you should have a better grasp of Einthoven’s triangle and how it can help you better understand the heart’s conduction system.
Summary
Einthoven’s triangle forms the basis for all standard ECG interpretation. By understanding the polarity of the three primary limb leads (Lead I, II, and III), which are used in conjunction with the augmented limb leads (aVR, aVL, and aVF), and the direction of the heart’s electrical vectors, providers can accurately deduce the origin of cardiac impulses. Lead II is the most frequently utilized monitoring lead because its positive axis (+60°) aligns with the normal flow of electricity from the SA node to the ventricles. Conversely, when impulses travel backward—such as in a Premature Junctional Complex (PJC)—the rules of the triangle explain why we see inverted waveforms, giving clinicians vital clues into the patient’s underlying rhythm.
More Free Resources to Keep You at Your Best
Editorial Note
ACLS Certification Association (ACA) uses only high-quality medical resources and peer-reviewed studies to support the facts within our articles. Explore our editorial process to learn how our content reflects clinical accuracy and the latest best practices in medicine. As an ACA Authorized Training Center, all content is reviewed for medical accuracy by the ACA Medical Review Board.
More to Learn

This article and video explain the differences between DKA and HHS. Learn how hyperosmolar hyperglycemic syndrome differs from diabetic ketoacidosis.
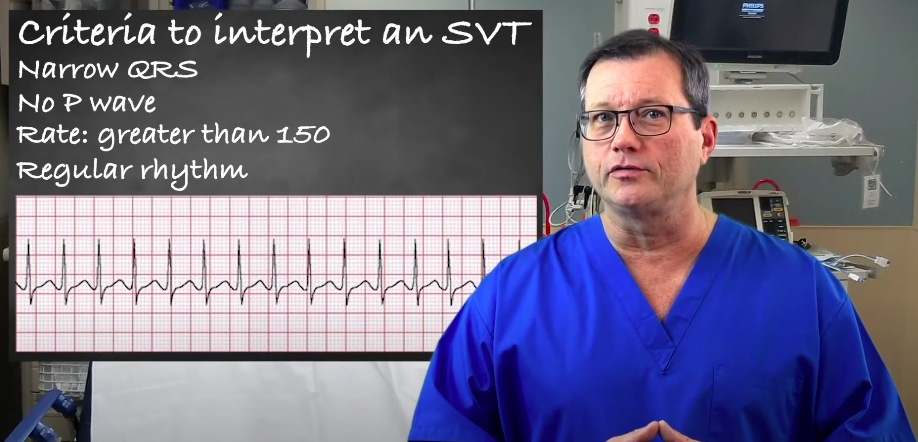
Understand the criteria and interpretation of supraventricular tachycardia (SVT) by reading our article. Learn to accurately identify and evaluate SVT.